This thread has been locked.

If you have a related question, please click the "Ask a related question" button in the top right corner. The newly created question will be automatically linked to this question.

RE: ADS127L01EVM: Output waveform

Hi Ryan.

I collected data with decimal number and got that results what does this mean?

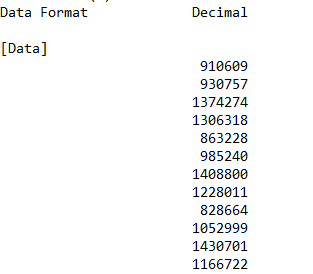
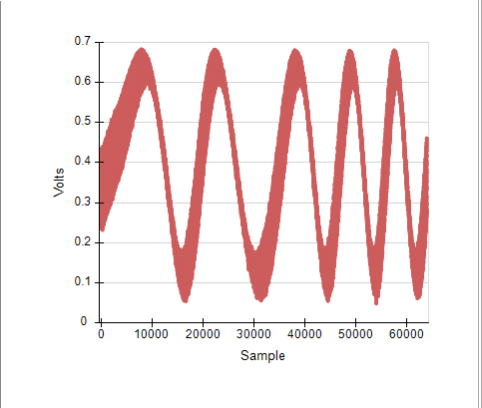
I expect results shown like diagram. What should I do


  • Hi Linh,

    What is the input signal that you are applying? Can you describe the configuration of your signal generator and the connections that you've made to the EVM?

    Best Regards,
  • Hi Ryan,

    I mean in data analysis tool, results are shown in graph in time domain tab is what I want to collect, but  in tab data inspector shows results like you see in the picture.

    Data inspector tab shows:

    Graph in time domain shows:

    I want to know how can I convert results in data inspector tab to the results in time domain tab.

    For example, at Count 0 ADC0 shows 910609. What does 910609 mean? I expect 0.xx V or something like that.

    Thanks you!

  • Hi Linh,

    What you're seeing are the output data codes. Multiply 910609 by the size of the LSB and it will yield a voltage value like you are expecting.