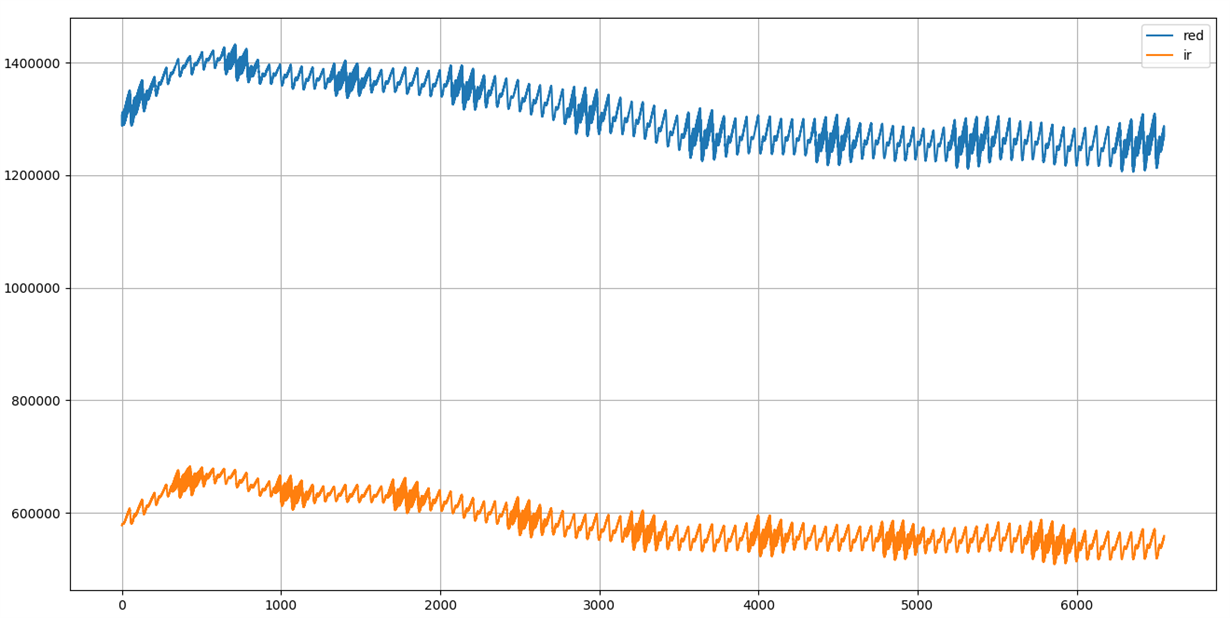
Below is the plot of RED,IR led raw data taken from afe4400 at 100hz. I am not able to understand the increase in the amplitude of RED and IR led at regular intervals, as there is no interference source nearby.
-
Ask a related question
What is a related question?A related question is a question created from another question. When the related question is created, it will be automatically linked to the original question.


