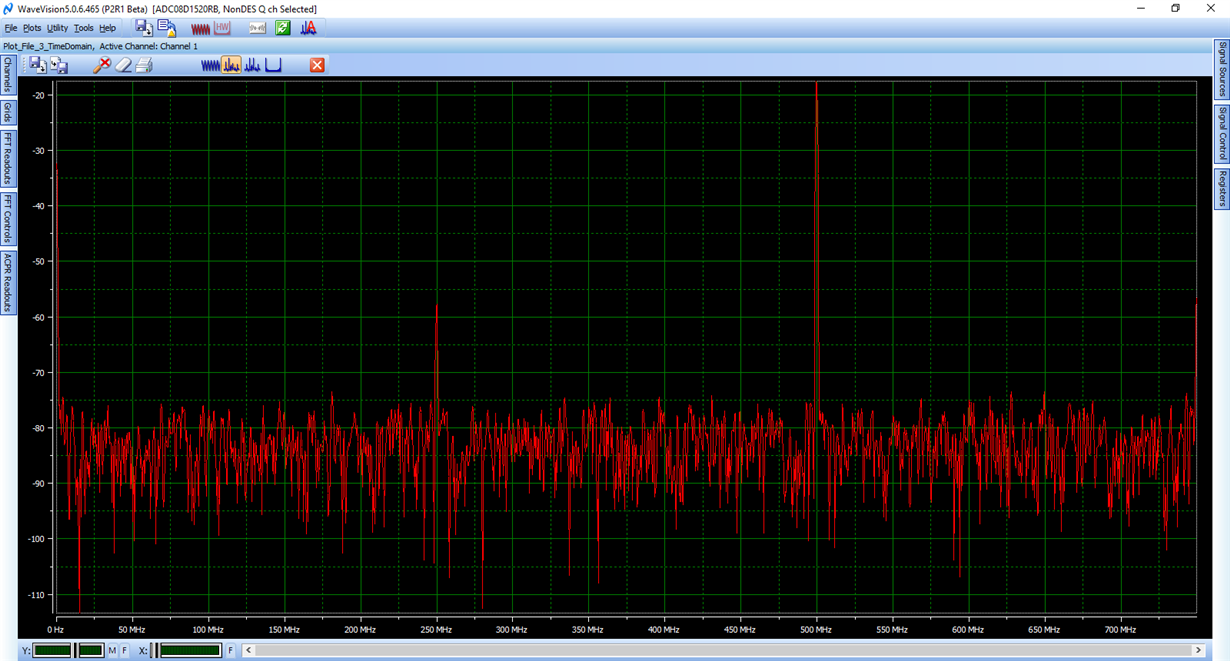
Hi Team,
My customer is evaluating the ADC08D1520 EVM and is having some trouble reading out their signal using the WaveVision tool. We have a couple questions:
1. Is there any way to increase the bounds of the x-axis in the FFT window? We wanted to sample at least a 2Ghz signal but the bounds seem to max out at 800Mhz with no option to expand.
For reference, they are actually sending the ADC a 1Ghz signal and the readout is shown in the figure attached. We are not able to see the 1Ghz signal, just it’s harmonic at 500Mhz. You can see on the x-axis that the highest measurable frequency seems to be 800Mhz. When we export that data it gives us the dataset which also ends at 750Mhz. We were hoping to send at least a 2Ghz signal.
X-axis scaling allows us to zoom in and out on the axis but doesn’t increase/decrease the bounds.
2. Is there a way to export the time domain data points into a .csv file?
When exporting in the time domain we get a single buffer (8k – 32k data points) but was hoping there may be a way to get more than that in an export?
Thanks,
Mitchell


