Hello,
TIers!
I have a few questions about ADCRF80EVM. We use ADCRF80EVM to sample a square wave signal with duty cycle of 1% and repetition rate of 1MHz. The result is different from that displayed by spectrum analyzer. I would like to ask you about it.
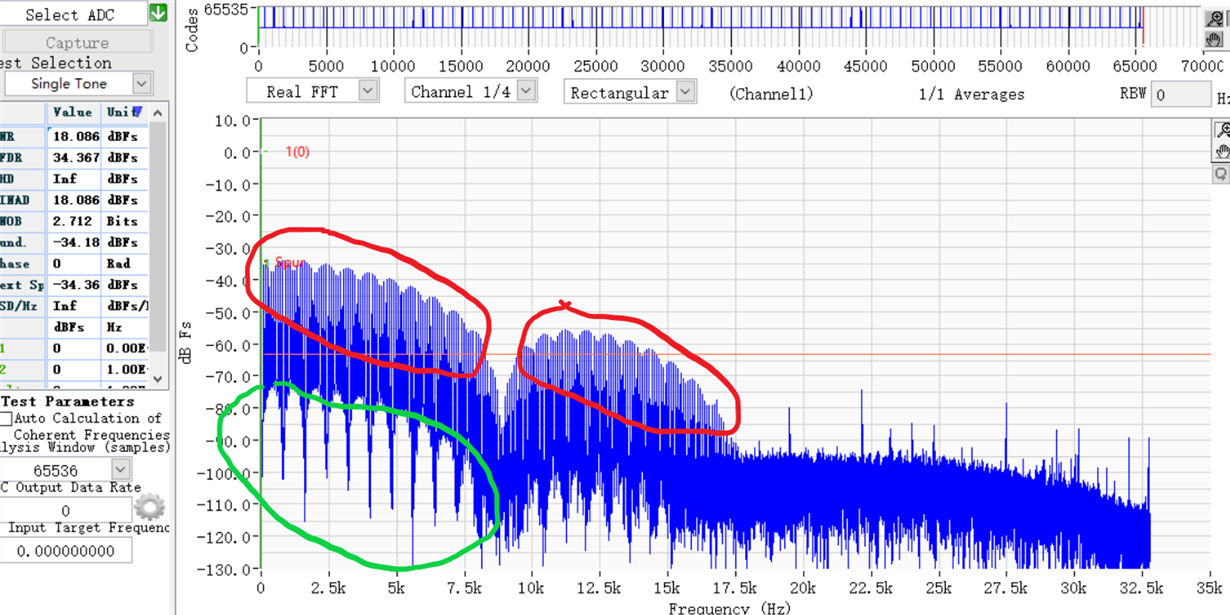
1. As shown in the figure, where I use the red coil, the spectrum changes periodically, similar to the amplitude modulation of frequency. Why does this happen? What causes this? We use spectrum analyzer to measure the spectrum of the pulse signal, and there is no such phenomenon.
2. The green line will show the spectrum of comb shape. What is the reason for this? We use spectrum analyzer to measure the spectrum of the pulse signal, and there is no such phenomenon.
3. Window functions in HSDC are divided into rectangular window, Hanning window, Hamming window and Blackman window. What are their specific representation functions? How to get the spectrum of original data without using window function?
Best regards,
David


