This thread has been locked.

If you have a related question, please click the "Ask a related question" button in the top right corner. The newly created question will be automatically linked to this question.

ADS131M04: ADS131M04: Test data shows phase unstable after implement phase calibration

Part Number: ADS131M04

Hello,

My customer test ADS131M04 and found its phase data varied from time to time with the same condition after using phase calibration.

Could you take a look and suggest why?

Test condition:

Two channels of ADS131M04EVM are feed with the same since signal. Phase calibration of one channel had been written 0x0a (4.092MHz, OSR=128, LP Mode, 16Ksps)

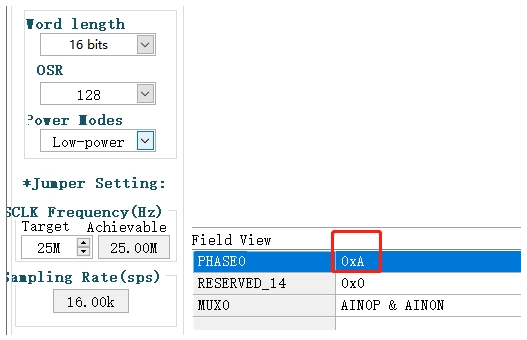
When customer read the data multiple times, they found the phase lagging or leading between the two signal. The following is the two different captured figures.


They have tried with  DRDY_SEL=0, 1, OR 2, the phase lagging or leading problem always exists.

B.R

Paul

  • Paul,


    There are a couple things that I would check. First, can you first have the customer check the version of the GUI software? In the tabs, go to Help -> About and the GUI should be Version 1.0.4, which comes from 21-May-2020. With previous versions, there might be an issue with the readout of the data after a pause in taking data. I'm not sure this would cause an issue like this, but I wanted to rule this problem out.

    Of the two data graphs shown, the first looks like the two curves are close to being in phase while the second looks like there is a significant phase shift. To be sure, both are taken with the same phase calibration settings? Do all curves look like one or the other of these curves? I just wanted to know if the apparent phase changes randomly with different measurements or if the phase differences are the same as the ones shown here.

    Looking at these curves, I would have guessed that the first curve is correct while the other curves looks larger than one data period. However, it's hard to tell just looking at the plots. If the customer can generate these plots again, can you have them left click over the plot. When they do that, they can export the data to excel and save it in a file. I'd like to review the data to see how much time delay there might be in the data.


    Joseph Wu

  • Paul,


    I haven't heard from you for a while, so I wanted to check with your customer's problem with the phase setting and collection of data. I thought that this problem may be because of the method of reading data after a pause in data collection that's described in the datasheet. I believe that this was fixed in the most recent version of the EVM GUI, V1.0.4 from 5/21/20.

    Hopefully your customer has downloaded the newer version of the GUI and doesn't see this problem. I did run a quick test, and didn't see this issue when I ran the same signal to channels 0 and 1.

    I'll close this thread for now. If your customer continues to have the problem, post back and we can continue to work on this data collection problem.


    Joseph Wu