This thread has been locked.

If you have a related question, please click the "Ask a related question" button in the top right corner. The newly created question will be automatically linked to this question.

DLP9500UV: DLP9500UV

Part Number: DLP9500UV

Hello.

I am working with Mentor HyperLynx SI tool. I need to define a TI LVDS eye mask.

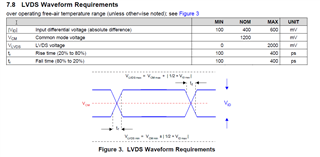
The TI datasheet specify the attached data. I am not sure how to translate it to the eye diagram in UI units.

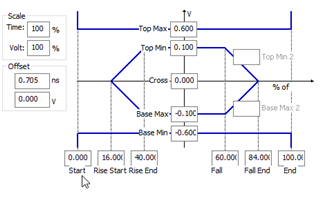
i attached the datasheet data and the mask a colleague created . is this correct? if yes , what is the calculation to achieve those figures.

thank you very much!
  • Hello Moshe,

    I will need to talk to some of our Signal Integrity people on this.  I should be able to have a response by COB on Thursday.

    Fizix

  • Moshe,

    Here is what our board team recommends:

    The Voltage numbers are correct.

    The timing numbers are close, however would recommend modifying them to the following:  

    Start

    Rise Start

    Rise End

    Fall Start

    Fall End

    End

    0%

    14%

    30%

    70%

    86%

    100%

    These numbers come from the following calculations/assumptions:

    •  The clock and the data split the setup time and the hold time between them 50/50. This is a simulation choice, and drives how much time there is before Rise Start and after Fall End. In practice, the clock is not likely to have as much jitter as the data, and there will be more setup and hold time available for the data UI. If we use a 50/50 split, this leaves 14% of the UI for setup and 14% of the UI for hold. à Rise Start = 14% and Fall End = 86%

    •  The maximum rise time in 1 UI = 16% and the maximum fall time in 1 UI = 16%. à Rise End = 30% and Fall Start = 70%

  • Dear

    Thank you very much for the detailed answer. few thing tough are still not clear to me.

    1. how did you reached to the conclusion that the rise time should start at 14%? or is it concluded in other way? (say from the mid point backward toward the start of the rise time?) if so, what was the calculation steps you did?
    2. do you take into account  the setup and fall time of 0.35ns as indicated from the datasheet?

    Many thanks

    ML

  • Hello again Moshe,

    The board team indicates that the 14% is a choice based on experience.  It is conservative and gives the best probability of a successful design.  

    Their advice is that if your clock jitter is large then you may have to make the values larger (i.e. 20%).  It it is smaller, then you can afford more time for the data.

    This should encompass the setup and hold time as indicated.  Maybe we are not understanding the second question correctly.

  • Hello Fizix.

    noted in regards to the start position.

    as for my 2nd question. as the Setup and Hold times are 350ps...we get 0.28UI (0.35/1.25)...i thought you mark the middle point (50%) and deduct from it 28% to meet the setup and add to it 28 to meet the hold times. from there, i deduct the 16% of the rise time and by this get the start point.....same manner for the hold time and fall time.....is this correct?

  • Moshe,

    Yes this should be correct.  It should give you a window of 0.56 UI across the top (i.e. 700 ps)

    Fizix