This thread has been locked.

If you have a related question, please click the "Ask a related question" button in the top right corner. The newly created question will be automatically linked to this question.

DLPNIRSCANEVM: DLPNIRSCANEVM

Part Number: DLPNIRSCANEVM

When measuring the spectrum, in some random spectra, some random value is missing. What could cause this and how could I solve it?

  • Jokin,

    Welcome to the E2E forums and thanks for your interest in our DLP technology.

    Can you be more specific about your query? Are you having an issue with a scan you performed? What are you scanning? How does it compare to your reference? Is it possible for you to share the data that you believe to be incorrect?

    Regards,

    Philippe

  • Thanks Philippe,

    I was measuring vinegar and the spectra is alright, just that in 3 of the around 100 spectra I measured, in one of the wavelengths (not the same in the 3 of them) the sample signal is 0, so the measured absorbance value says "inf" (infinity I guess).

    For example:

    1695.259755,inf,34831.000000,0.000000

    In context of the file (I'm just including the wrong value wavelength, the rest is OK):

    Method:,Hadamard 1,,
    Host Date-Time:,28/7/21 @ 11:53:16,,
    Header Version:,1,,
    System Temp (C):,33.72,,
    Detector Temp (C):,31.5,,
    Humidity (%):,61.05,,
    Lamp PD:,3784,,
    Shift Vector Coefficients:,-8.43052,0.06358,-0.000118553,,
    Pixel to Wavelength Coefficients:,1787.11,-0.908224,-0.000246691,,
    Serial Number:,6100156,,
    Scan Config Name:,Hadamard 1,,
    Scan Config Type:,Slew,,
    Section 1,,
    Start wavelength (nm):,900,,
    End wavelength (nm):,1700,,
    Pattern Pixel Width (nm):,   7.03,,,,
    Exposure (ms):,  0.635,,,,
    Digital Resolution:,228,,
    Num Repeats:,10,,
    PGA Gain:,64,,
    Total Measurement Time in sec:,  3.427,,
    Wavelength (nm),Absorbance (AU),Reference Signal (unitless),Sample Signal (unitless)
    1695.259755,inf,34831.000000,0.000000
  • Jokin,

    Do you have the spectrum file itself to share?
    Regards,

    Philippe

  • Jokin,

    Thank you very much. Give us a few days to review and get back to you.

    - Philippe

  • Hello Jokin,

    Thank you for uploading  the CSV file. I do have few follow-up question:

    1. Are you using standard EVM configuration with reflective head?

    2. You are scanning Vinegar which believe is in liquids state. How are you presenting  sample for scanning?

    Typically vinegar is very transparent and measured signal intensity is very low. You may not be presenting the sample correctly for scanning and measured signal could be simple reflection or scatting of light from the surface of the sample container. 

    With Hadamard scanning and PGA gain 64, I would expect the signal saturation, not such low values.

    Could you please also share a picture of how you are presenting the sample?

    regards,

    Vivek

  • Hello Vivek,

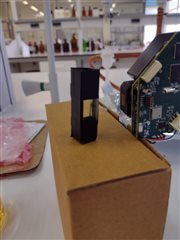
    Yes, I am using the standard configuration but as you say vinegar is very transparent so doesn't reflect too much. I measured it using a cuvette that has a trasnparent side on the sensor side and aluminium foil on the opposite side (attached picture, aluminium missing), so I'm measuring in "transflectance" mode. Obviously this is not a proper way, I was just doing some tests. But I got the proper spectrum of the vinegar, as I compared to the ones I got using another device. I'm just worried of the missing values because I want to use some automated processing and this would mess things up, I want to know if it hapens often or there's some issue I could fix. As I say the only problem I got was this random missing value in 3 of the 100 spectra, everything else is alright.

  • Jokin,

    Thanks for the input. The team should be able to provide feedback within the next couple of days.

    Regards,

    Philippe

  • Hello Jokin,

    In you system setup, the reflected light signal is very week. It is very likely that missing values are because of that.

    The best option is to use a transmissive head with Cuvette. This will provide you the best and consistent result.

    The following are the issues with the set up:

    1. reflective head is designed to place the object against the windows. Any distance between reflective surface and window will reduce the light getting into the DMD through optics. Even though you see  expected pattern in spectrum, your SNR will be very low. This will result in inconsistent result. If you have to use a cuvette with transmissive head for automation reason then please use a thinner cuvette which has smaller light  path length. The cuvette  should be placed against the windows.

    2.  You are using Hadamard scan with 64 PGA gain.  Hadamard scan provides at 3-4 times light over column scan. With 64 PGA gain, the measured brightness is very small number comparted to reference value of lamp.  You can understand that how low incoming light is. First try to improve your set up using  column scan and 1 PGA gain. Try to improve the intensity by adjusting the set up.  If you are getting a reasonable spectrum with this then change to Hadamard for a better SNR.

    regards,

    Vivek

  • Thank you very much Vivek,

    We intend to build a more robust set up for vinegar analysis and will make good use of this information. I will come back with more information if this problem persists, I hope not.

    Jokin