This thread has been locked.

If you have a related question, please click the "Ask a related question" button in the top right corner. The newly created question will be automatically linked to this question.

DLPNIRNANOEVM lamp power and Bluetooth data format

Other Parts Discussed in Thread: DLPNIRNANOEVM, DLPA2005, OPA567, ADS1255, HDC1000, DLPC150, TMP006, DLP2010NIR

Hi,

I am getting a DLPNIRNANOEVM soon and planning to do some modification. Here I have some questions.

1. The two lamps that Nano uses seem have much lower output power than the one used in the DLPNIREVM, so is that any reason that Nano uses different lamp? And will DLPNIRNANOEVM support lamps with bigger output power?

2. I am planning to connect the Nano to my own phone plot apps via Bluetooth connection. So what kind of data format is DLPNIRNANOEVM using?

Thanks,

Jerry

  • Hello Jerry,

    Welcome to the DLP Advanced Light Control section of the TI-E2E community.

    1.  The NIRscan-Nano platform targets the mobile market powered by a battery or over (i.e. 500 mA), therefore the lower power lamps were used and they only turn on briefly when a scan is performed.  if a higher power lamp is used, an enhanced lamp driver (likely with its own power) will have to be used.

    2.  Plots can be saved and exported to a CSV format.  If you want to know what the format is that comes over Bluetooth to the phone, the source code for the IOS app is available as a reference and starting point.  The Android version is not yet available, but is expected to be release by KST in the not too distant future (stay tuned).

    Fizix

  • Hi Fizix,

    Really appreciate you very much for your prompt help.

    For the lamps, how stable are they? Do they need warm-up time before the Nano scans? As I know that they need time to get stable stable and the output may vary from time to time so how does the Nano make sure the stable output during the scan and between different scans? Does Naro take the lamps power into considerations when calculate the results?

    As to the Bluetooth data transmission, where can I find the source code for the IOS App?

    Thanks again,

    Jerry 

  • Jerry,

    The DLP NIRscan Nano had among its design constraints: USB powered, battery powered, and small size.

    As you can see from the picture below:

    • The lamp of the DLP NIRscan (ILT 8008) is as tall as the height of the DLP NIRscan Nano engine ~10mm.
    • Also the lamp of the DLP NIRscan consumes 750mA, which is much more than the total USB 2.0 power consumption budget of 500mA.

    For small size and low power, we chose two lens-end lamps (ILT 1088-1). Each lamps consumes 140mA each. 

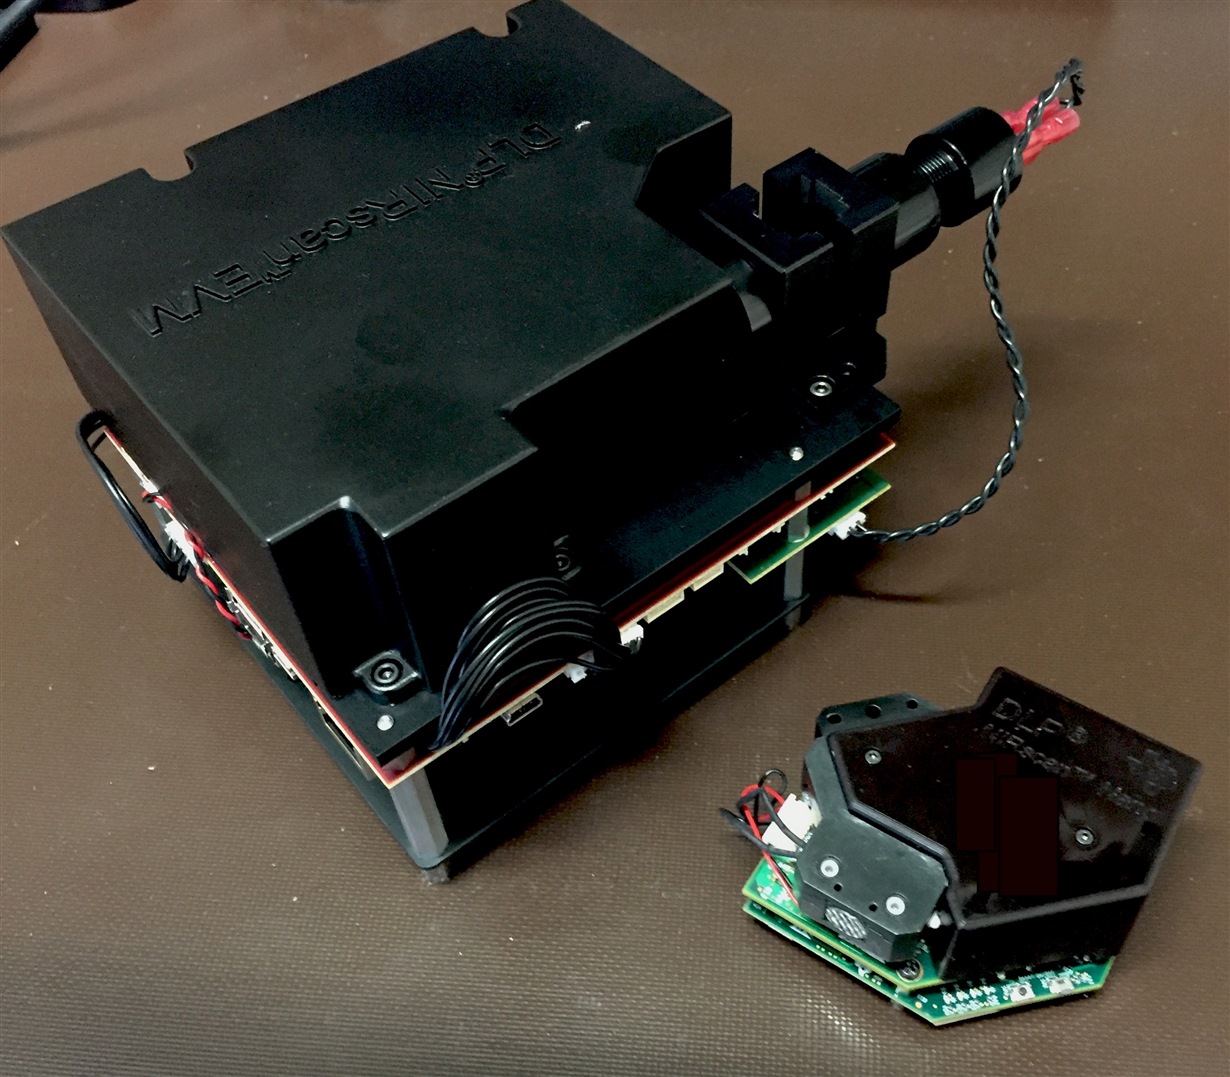
    For comparison on the sizes of the NIRscan and NIRscan Nano, see the picture below:

    In addition to Fizix description of the data format, the DLP NIRscan Nano also saves scans to a microSD Card in binary format. This data can be transferred with the iOS App over Bluetooth and stored in the App in *.CSV format. The App also has the capability to e-mail the data in *.CSV format. Furthermore, the PC GUI also offers the batch conversion of the binary scan contents of microSD Card into *.CSV files.

    best regards,

      Pedro

  • Hi Pedro,

    Thanks for your reply.

    Is the low power from the lamps related to the 6000:1 low SNR or the resolution?

    For the Bluetooth part, do you mean the IOS APP actually pulls the binary data from the MicroSD? The source code will be definitely helpful.

    Best regards,

    Jerry
  • Jerry,

    In our testing the worst case condition we measured was well under 625msec to stabilize the lamps. After the lamp have stabilize, they are pretty stable. This stabilize time is actually a compile option on the Tiva code. Look under the source code in App/include/common.h for #define LAMP_STABLIZE_DELAY. So if you change the lamps, it is easy to change the code.

    When the DLP NIRscan Nano performs a scan, the following actions occurs:

    • Power up the DLP Subsystem by driving high the PROJ_ON signal of DLPA2005.
    • Power up the lamps by enabling the OPA567. Read timer to grab start time.
    • Wake up the ADS1255 by sending a wake up command through the serial port.
    • Read humidity and temperature data from HDC1000.
    • Wait 100 msec after powering up the lamps so as not to power the rest of the system while the initial lamp power surge occurs. This wait is based on the timer difference from the timer value read on the second step.
    • Enable Tiva LCD peripheral.
    • Setup DLPC150 to take data from 24-bit RGB interface.
    • Read temperature data from TMP006.
    • Wait up to 625 msec after powering up the lamps for lamp stabilization. This wait is based on the timer difference from the timer value read on the second step.
    • Read photodetector
    • Program DLPC150 to take patterns from 24-bit RGB interface and display them on the DLP2010NIR.
    • Perform a quick scan to set ADS1255's programmable gain amplifier (PGA) to the maximum value that does not saturate the ADC.
    • Tiva streams patterns to the DLPC150 while obtaining ADC data. Multiple ADC values are read per pattern and averaged. The pattern set is repeated depending on the number of times a scan is repeated.
    • When the scan is finished, read temperature and humidity from TMP006 and HDC1000.
    • Power off the lamps disabling OPA567.
    • Power off the DLP Subsystem by driving low PROJ_ON signal of DLPA2005.
    • Populate scan data header and values

    There is a photodetector under one of the lamps, the photodetector value is read at the beginning of every scan and stored with the scan data. Thus, the lamp intensity is captured with each scan, as well as temperature and humidity. So in theory the system could be characterized for different lamp and environmental conditions and compensated. Also a reference scan can be stored in the system, so as the lamp ages or there is an extreme change in environmental conditions, the reference scan can be updated with the PC GUI to provide a much better absorption plot.

    As far as the iOS app code, KS Technologies will publish it in github soon. You can sign up on their website to be notified when it is published.

    For Bluetooth transmissions, we are using GAP and GATT profiles. The supported services are described in the NIRscan Nano User's Guide. I just submitted an update of the User's Guide and should be out next week. 

    best regards,

      Pedro

  • Jerry,

    The wavelength resolution is dependent on the convolution of slit width, optics, and DMD array size. For a given optics and DMD array size, then the slit controls the resolution. Different wavelength of this slit image are spread horizontally across the DLP2010NIR DMD. The optical system images 900-nm wavelengths to one end of the DMD and 1700-nm to the other end, with all other wavelengths sequentially dispersed in between. Thus, using a smaller slit results in improved resolution. However, smaller slits lead to less light into the system and thus increase SNR. So, the slit size was chosen to balance wavelength resolution with SNR of the spectrometer. By using Hadamard over a Column scan, the SNR is improved.

    As far as data stored. When there is an microSD Card in the system and the scan button is pressed, the scan is stored in the microSD Card. The scan command has a parameter to request the data to be stored or not stored in the microSD Card. Currently, the software has it set so that USB and Bluetooth commands do not store the requested scan in the microSD Card. The scan data is just sent after the scan command in binary format. The DLP Spectrum Library has routines to extract the binary format.

    Best regards,
    Pedro
  • Hi Pedro,

    Appreciate your replies very much and they are VERY helpful.

    For the current lamps, given the lower power, have you ever tried to use Nano for material in a clear plastics container or different glass bottles, clear or dark?

    Thanks,

    Jerry

  • Jerry,

    We have used plastic "zipped locked bags" with samples that we rest on the DLP NIRscan Nano sample window that is facing up. We have also taken good scans of ketchup and honey packets that have a clear side. Glass tends to block infrared light, so those might not be suitable.

    The reflectance module is designed to focus the light about 0.5mm past the sample window, so as long as the container is mostly IR transparent and thin, it will penetrate. To counteract any effect of the plastic, we take our reflective sample and wrap it with the same plastic and set that as our reference sample for absorption plots.

    Best regards,
    Pedro
  • Hi Pedro,

    Thanks for the reply.

    I have got my Nano today and here are my questions after I played it for a while.

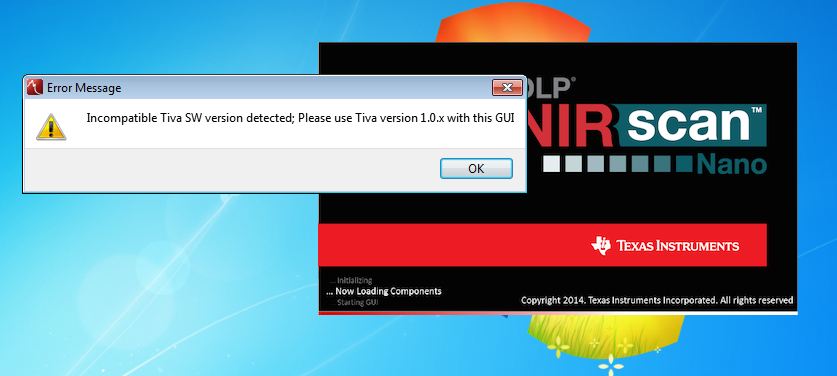
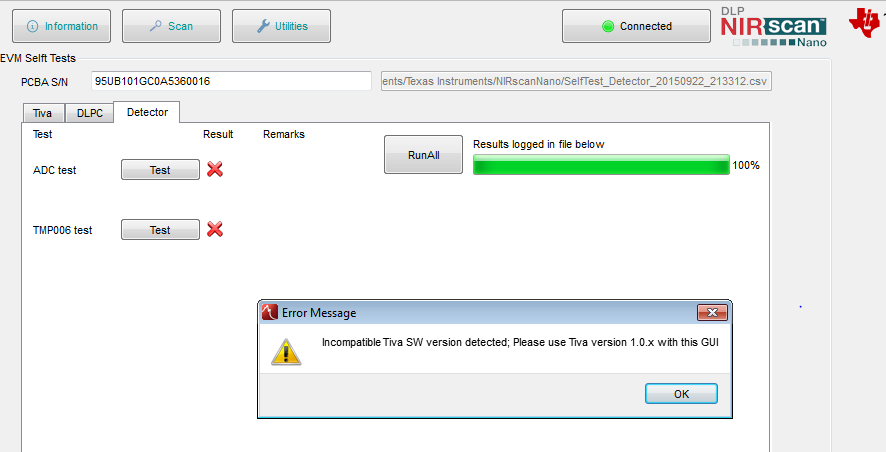
    1. After I run the GUI and connected the Nano, here is the error message, how should I get he right Tiva SW?

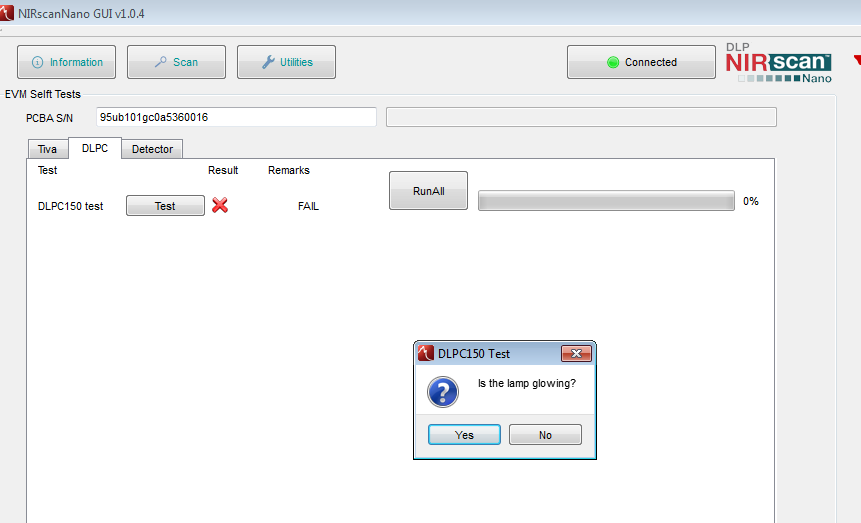
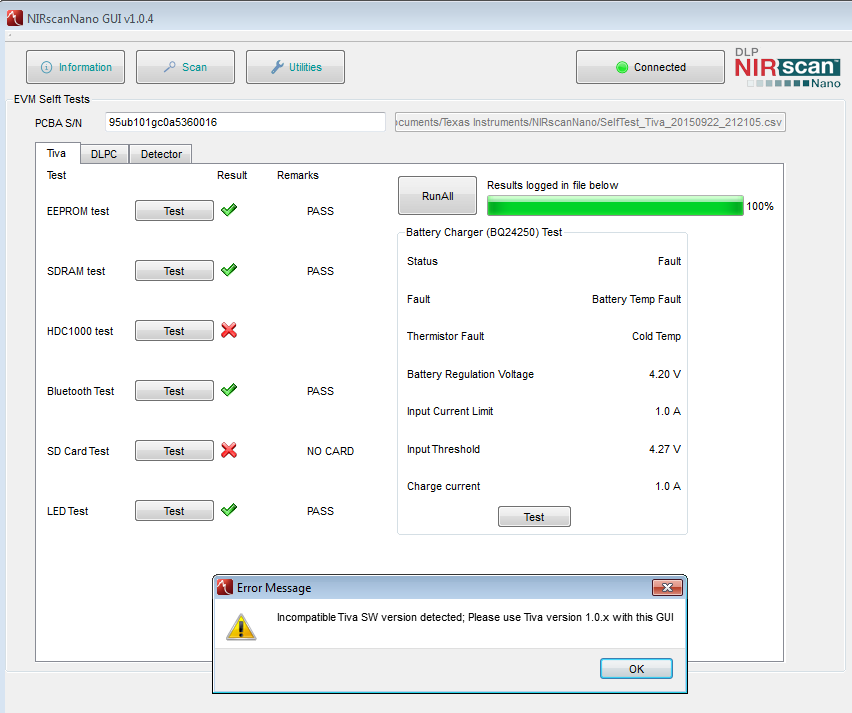
    2. When I run the self tests, here are the error messages, understand the SD card one and how about the others?

    Lamps don't glow during this test

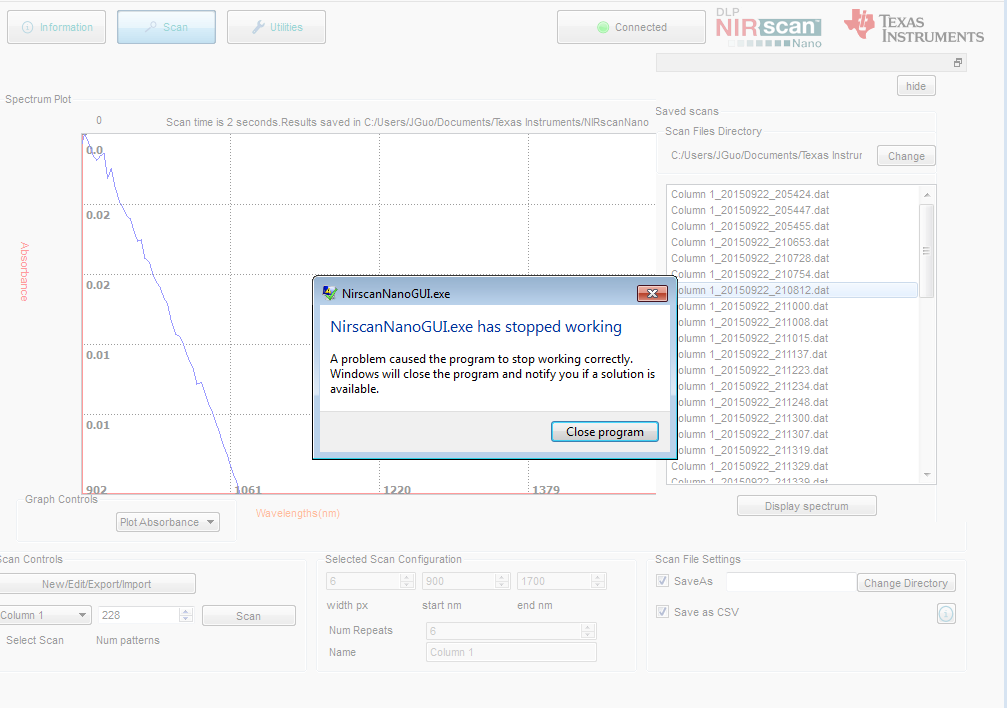
    3. When pulling data from scans, the program stops working.

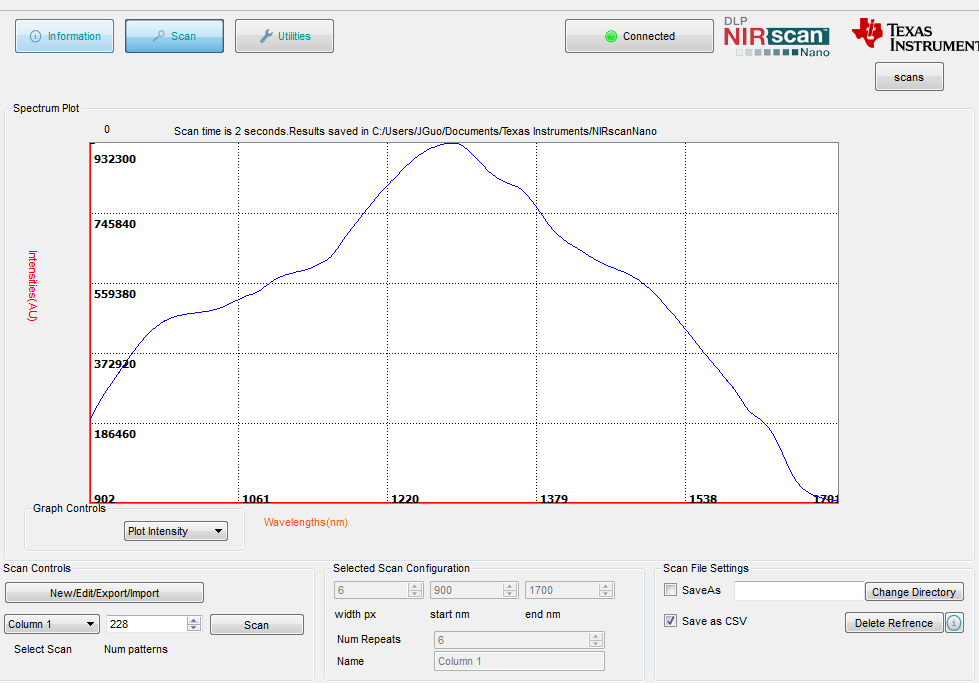
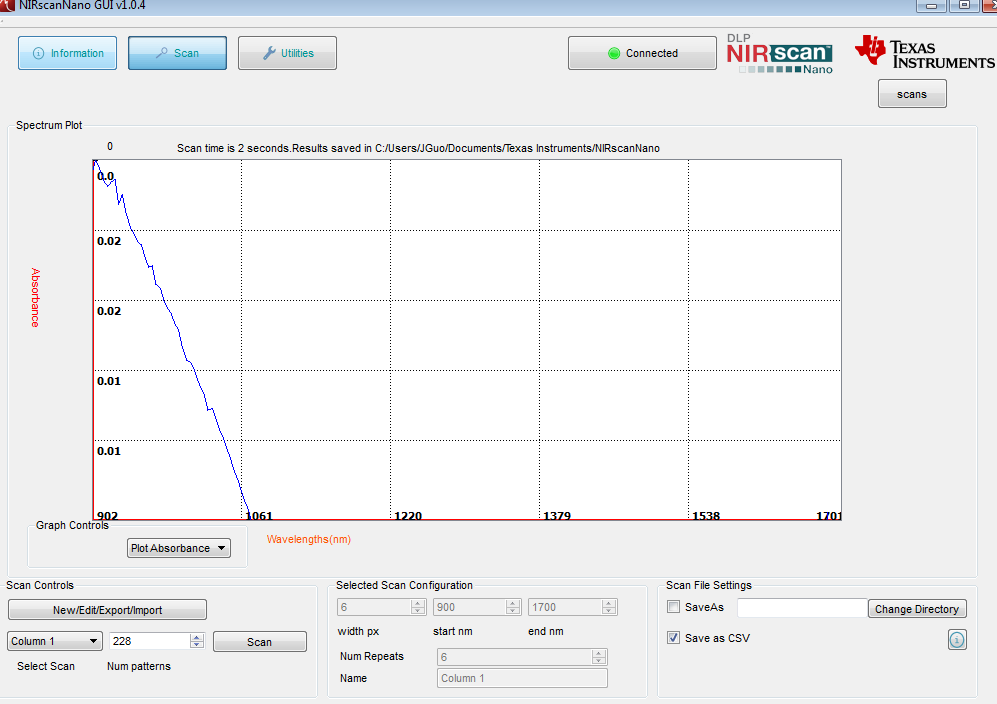
    4. Here are the intensity and absorption plots for same scan, why does the absorption one (2nd) not look like the opposite one from the first one? And why they have so different Y-axis amplitude?

    Hope nothing is wrong with my Nano.

    Thanks,

    Jerry

  • Hi Pedro,

    It seems all the pictures I have pasted did not go through. Here I tried again.

    Question 1. After I run the GUI and connected the Nano, here is the error message, how should I get he right Tiva SW?

    Question 2,  When I run the self tests, here are the error messages, understand the SD card one and how about the others?

    Lamps don't glow during this test


    question 3, When pulling data from scans, the program stops working.


    question 4, Here are the intensity and absorption plots for same scan, why does the absorption one (2nd) not look like the opposite one from the first one? And why they have so different Y-axis amplitude?


    Hope nothing is wrong with my Nano.

    Thanks,

    Jerry

  • Jerry,

    Due to different features that we have enabled, we placed version checking on the GUI. So please make sure the GUI and Tiva firmware match. We just released version 1.1.8 on the external site.

    We also just released the updated User's Guide for version 1.1

    Make sure that the GUI and Tiva firmware match. The newer version of the GUI adds new commands which might make some of the test fail. I would recommend to load the latest set of software:

    • GUI v1.1.8
    • Tiva v1.1.8
    • DLPC150 v1.1.0

    As far as the tests:

    • DLPC150 just powers up the DLP Controller board and turns on the lamps. If you click yes on the lamp glowing dialog, it will pass the test. If you click that the lamp are not glowing, the test fails.
    • HDC1000 test sends commands to read the Humidity and temperature data from HDC1000 through I2C interface. A failure there indicates that Tiva could not communicate with the HDC1000. This data is also read under the Utilities Tab by clicking on the Read button under the sensors section. The HDC data is under Humidity and HDC temp entries. Test to see if you see a USB error or a weird value reported there.
    • SD Card test reads and writes to a micro SD Card. if one is not present, it will fail. A pass indicates a successful text file creation, filling it with info and being able to read it back.
    • ADC test sends commands to the ADS1255 through SPI interface. A failure indicates that Tiva could not read the registers of ADS1255,
    • TMP006 tests sends commands to read the temperature on the detector board through I2C interface. A failure indicates that Tiva could not read the registers of TMP006.

    Given the failures and the program hanging during a scan, there is probably a mismatch on GUI and Tiva firmware. I do not think there is nothing wrong with the Nano. Please download and update to the latest firmware. We have fixed several issues and made the GUI slightly better organized.

    As far as the plots, on that version of the software, the absorbance plot was based on a previously stored reference scan on the PC. So that plot is highly dependent on what was previously set as reference. Version 1.1 of GUI uses the reference scan stored at the factory on the DLP NIRscan Nano.

    • Reflectance = intensity/reference
    • Absorbance = -log(intensity/reference) = -log(Reflectance)

    Since Absorbance is a log plot, the magnitudes are much smaller.

    Best regards,

      Pedro