


Dear,
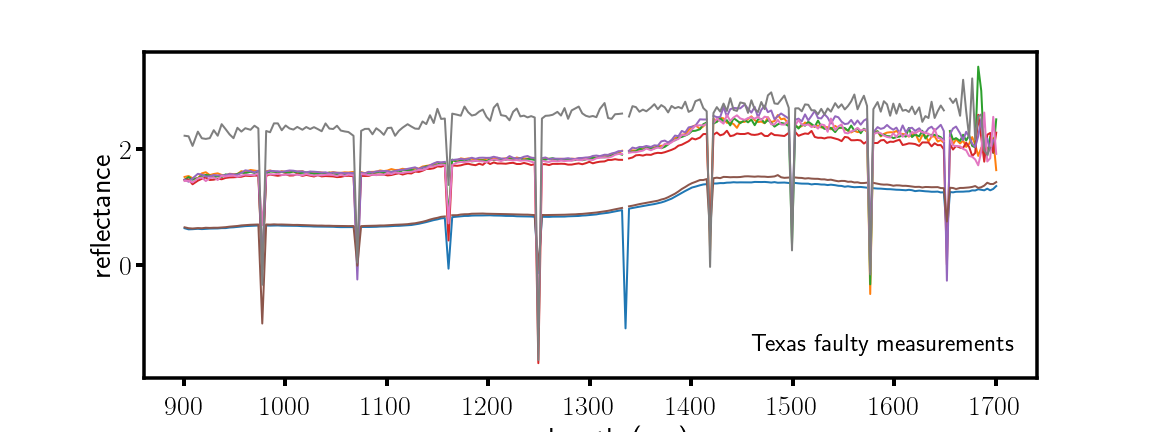
We have been measuring chicken with your DLP nano device that we bought earlier this year. It worked fine for a while but now we are facing downward peaks at regular intervals. You can see this in the attachment (Texas Faulty measurements). Is this any familiar to you? Do you have any explanation for this?
In addition, we have seen some other irregularities when we were looking into the spectra. We saw that their is a decreasing width (in nm) with increasing wavelength. I.e. we expect measurement intervals of 4nm, but they tend to decrease towards 3.5. In addition, at regular intervals their is a higher width, starting from about 5 at 900nm decreasing towards 1600 but still higher than the normal width. You can see this in the attachment wavelength spacing texas (X axis wavelength, Y axis wavelength spacing). Is this normal behaviour, would you expect this? Is this linked to the issue above? The higher width of about 5nm is not coinciding with the downward peaks faced above.

