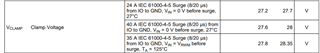
Hi team,
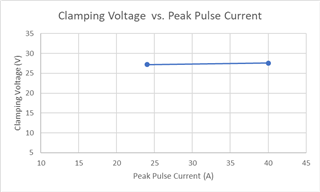
we need I-V curve to show our dynamic resistance to customer,
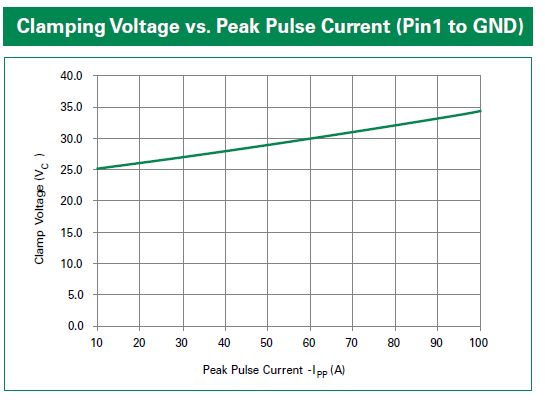
datasheet only have large scale.
we need a curve around same scale as below one, please support this thanks
Hi team,
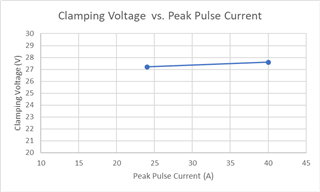
we need I-V curve to show our dynamic resistance to customer,
datasheet only have large scale.
we need a curve around same scale as below one, please support this thanks