


Tool/software:
Hi All,
Texas Instruments uses PCIe redrivers to perform signal conditioning on medium to upper medium loss systems. The redriver is effective in a wide variety of systems with losses ranging from -36dB to -56dB. As a result, the tuning that needs to be done to maximize the margin between the endpoint and the root complex is very fine and often can have multiple possible options. Additionally, there is another layer of complexity in the form of DC gain because certain links will need a small amount of amplification or reduction for improved margin. The difficulty becomes then, how does one find the optimal setting for the redriver tuning position?
Although there are many tools (IOMT, AMDXIO, PCI_LMT) that can provide margining information at the CPU and sometimes at the endpoint in the form of eye height in mV and eye width in UI, there is only one tool that can provide information at the output of our redriver, and that tool is eyescan.
Eyescan provides a histogram from a DAC sweep measurement at the TX of our redrivers. Imagine there is a horizontal line moving vertically upward on an eye diagram. At the lower end of voltage, in the -300 to -400 mV range, there will be 0 hits. This is because no bit transitions are reaching this level of voltage. Then, the DAC moves up a step. The steps can be 12.5mV, 9.375mV, 6.25mV, and 3.125mV. After it moves up the amount of the step, it then counts the hits at that level. This time, there are 400 hits. The horizontal line has reached a point where the bit transitions are accumulating. But, why are the bit transitions accumulating at this point? Well, you can divide an eye diagram into 3 main parts. 1 is the low level position 2 is the high level position and 3 is the transition between those positions. In an eye diagram, the low level and high level positions will be points of accumulation for data. This is because as data is transmitted, the majority of the time, it is either 0 or 1. Back to the eyescan and the DAC step. The reason that there are now 400 hits is that the horizontal line has now hit the low level position. It will then continue moving up the eye and measure the hits at each mV height of the low level position. Eventually, it will move into another portion of the eye diagram, the transition between the levels. At this point, it can then sample the eye itself. In the eyescan, this looks like a flat portion. Below, is an image of an eye scan where the flat portion is visible.
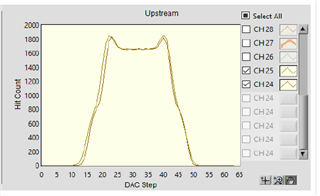
Notice how there is a flat portion in the waveform. The horizontal line is moving between the high and low positions. The amount of steps between those two peaks can be thought of as the eye height. Somewhere in the middle of the number of DAC steps required to sample the entire eye, there is the center of the eye. The horizontal line continues upwards, in step intervals denoted above, and reaches the high level position. At first, it registers a higher amount of hits. This can be seen as the small upward bumps at the corners of the waveform. There are more transitions here because there is an accumulation of hits around the high level position. The DAC continues upwards and moves through the high level position just as it does with the lower level position.
Please ensure you understand the functionality of the eyescan before continuing and then see these conclusions:
- Increase the flat portion as much as possible
- The wider the flat portion the taller the eye.
- The small upward bump on the eye denotes overequalization because it means that a portion of the high level/low level positions are spread out. There is essentially a node within the high level position with a greater number of hits than the rest of the position. This means that there are points in the high level position that are above average.
- Overequalization is a good thing for high loss links.
- Eyescans on the downstream side are thinner.
- Occasionally, the per channel sweep of the eye diagrams at the different channels shows differences per channel. Please follow our layout recommendations in the datasheet of our Gen 5 redrivers to ensure a regularity in PCB traces to avoid this difference in eyescan per channel
Best Regards,
Nick