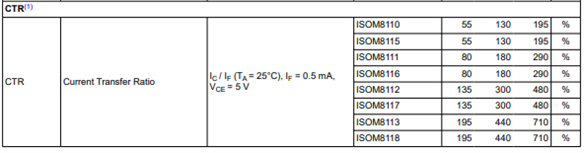
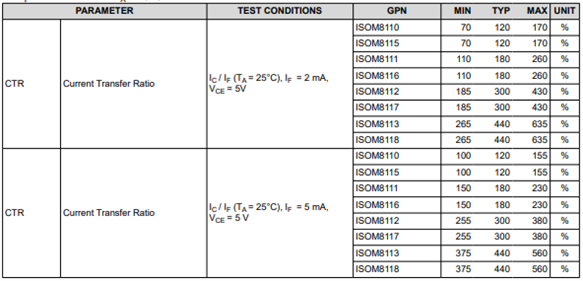
CTR variation with respect to temperature is found is datasheet, Can you share us the graph if it is available.

-
Ask a related question
What is a related question?A related question is a question created from another question. When the related question is created, it will be automatically linked to the original question.