This thread has been locked.

If you have a related question, please click the "Ask a related question" button in the top right corner. The newly created question will be automatically linked to this question.

THS-788 - Maximum sustained SYNC rate ???

Other Parts Discussed in Thread: THS788

Hi,

We have been working on a board for time measurement application for the past two years using your THS788 TMU, and we discovered this week that is was operating in a very weird way when using a higher clock rate for the SYNC input.

Here is the situation :

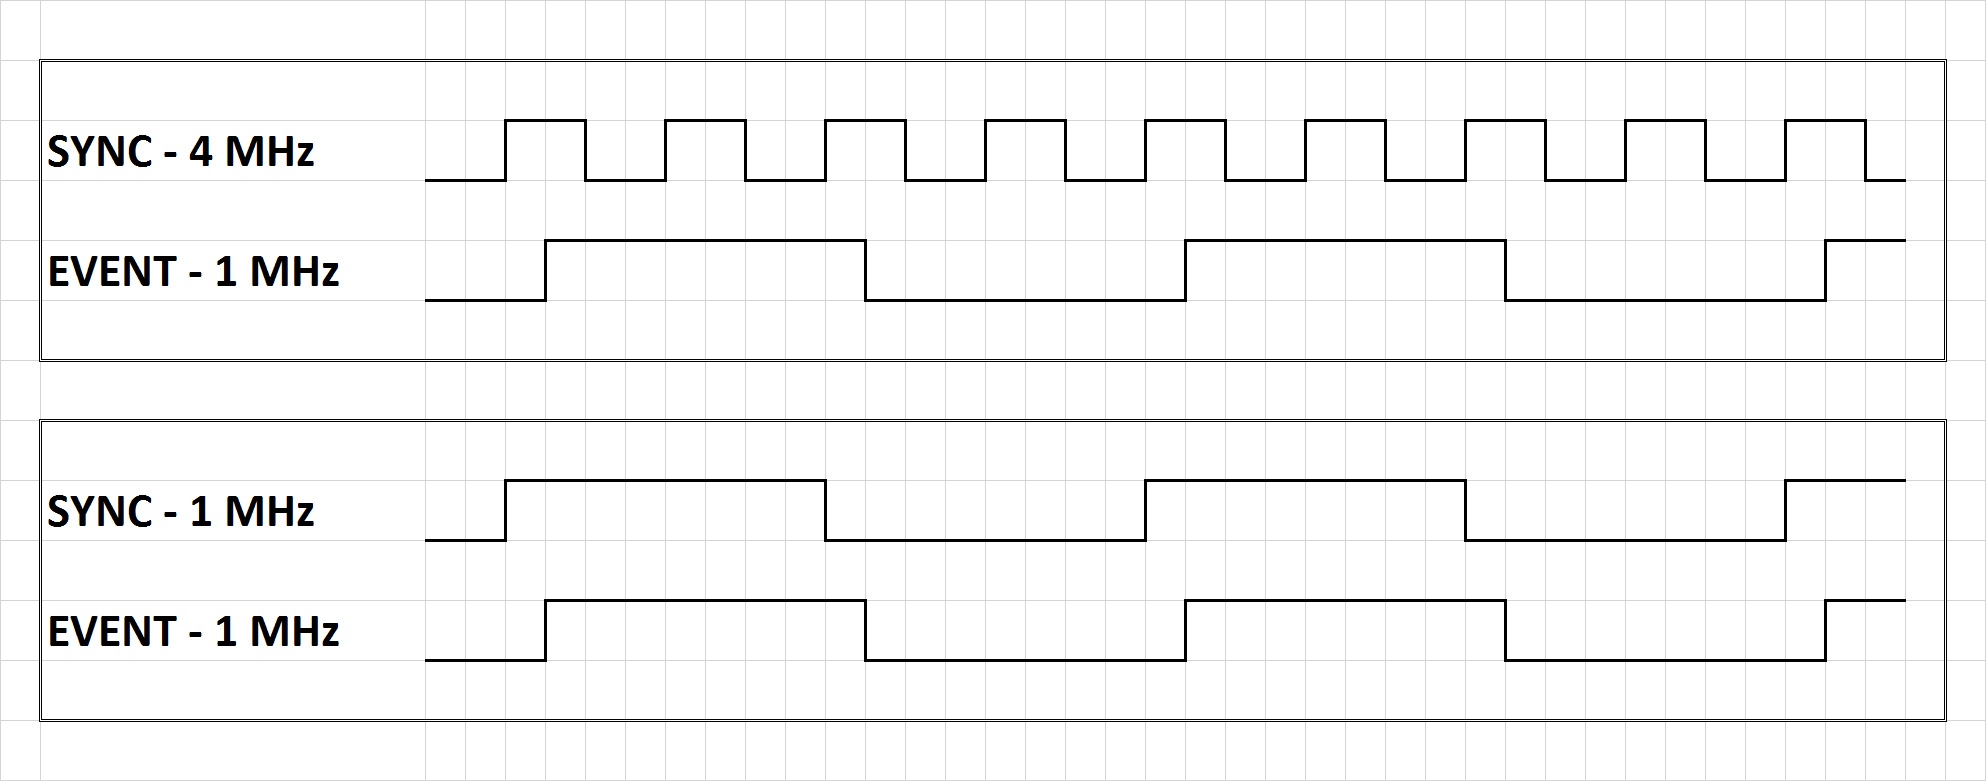
- We are using it in a SYNC-SYNC-SYNC-EVENT processing way, which means many sync period can have no event pulses.

- The chip runs perfectly using a 1MHz SYNC clock and a 1 MHz EVENT input rate using the oboard pulse generator, with a 8ps sigma as promised.

- When using the exact same event input (1 MHz), but a reference clock at 4 MHz, some quantification error start to occur generating really weird histograms. Some smaller peaks appear at (Main peak + 8/16/32 bins). I have attached a picture of this histogram. I have used a logY axis to show more clearly the problem.

I cannot understand why this happens, and it becomes worst as the frequency of the sync pulse increases.

Since this system is supposed to work at a 80MHz SYNC rate, it is impossible to make this project work without understanding what is happening.

Here are some of the operating specs :

-Data clock rate : 150MHz

-Positive to positive Edge 

- 34 bit global counter

- 16 bit results output

- No holdoff - No calibration - No arming conditions

- All power supply are low noise LDO

-All signal are buffer with extremely high rise time

-TDC is cooled with heatsink and fan

I understand that this product is now NRND, but I still need to make that project work... We have a lot of money invested in this and we need to find a way to make the THS788 work.

Please advise...

Jonathan

  • Jonathan,
    I am not certain this is all of your issue, but I believe at least part of your issue is the uncertainty of which sync pulse is used for calculation of result. This is somewhat explained in the datasheet for load pulse timing.
    The faster the sync rate, the more likely that newer sync will be used for an event. This should result in a negative timing result.
    Can you explain what your BIN values represent (are these timestamp values)? What is the timing of events and sync at the device in both cases? Can you provide a timing diagram?
    Regards,
    Wade
  • Hi Wade,

    -Yes the BIN in the diagram is the timestamp value (13.02 ps per bin)

    - I am aware of the negative timestamps. At 4 MHz, it happens around 25% of the time. But this doesn't explain why the binary pattern appears at  Peak + 8 bin/16 bin/32 bin. We correct the negative timestamp in normal operation, but I excluded the negative on the presented drawing.

    -Attached is a timing diagram. The delay between SYNC and EVENT is approx 1ns, hence the peak at bin 70 (911ps).

  • Thanks for the information.
    Is data from single channel or multiple?
    Is this from only one device or multiple?

    Can you advise on the date code on the device(s). We have implemented additional screening to help eliminate devices that exhibit a bit error. This may or may not be related to what you are seeing.
    If you can provide some of the raw data without sync adjustments, then it may help identify cause.

    This condition is temperature sensitive, and may be exaggerated due to device being sensitive to moisture.
    This can cause delamination during assembly or if improper thermal management during operation.

    What type of thermal management (heat sink) are you using?

    Regards,
    Wade
  • Hi Wade,

    - Previous data is for a single channel, and the exact same result is obtained from 2 different chip (Used Channel A). I'm gonna get back to you ASAP with results from channels B to D.
    - The date codes of the devices are : 29ARVYTG4 and 46CD42TG4
    - The data is raw (however in histogram form), without the SYNC adjustment. We shut down the SYNC feature to ensure most accurate measurement.
    - The chip is mounted with a Advanced Thermal Solution ATS-1141-C1-R0 Heatsink (1.6°C/W @ 200 LFM) using Wakefield Type 120 Thermal Joint Compound, and cooled with a 80mm fan blowing directly on the heatsink. Temperature should not be varying with this setup. I could get some readings from the temperature sensor of the ASIC if required, but I'm sure we operate in the appropriate temperature range.

    Can you tell me more about the devices exhibiting this bit error? Because the problem really seams to be linked to a single bit error (which would explain the binary pattern the peaks at +- 8 bin/16 bin/32 bin.
  • I would be interested to see how the other channels compare.
    This does not appear to be related to the BER issue that I mentioned. We have only seen it impact single bits and results tend to indicate a stuck bit in the FIFO from the counter. So there is a pattern to the data in that it will only show up at modulus 16 events (a particular FIFO address). We have only seen this impact a single bit. The histogram appears represent errors on several bits.

    Do you have raw data, or is the histogram binning handled by hardware without recording results? It would be interesting to see if there is pattern in the errors.

    There are several things you can try to see if they clear up the errors.
    Make sure to reset device, then configure.
    Validate that register settings are as expected. (Can you provide a dump for reference?)
    Reduce the counter size, as your counter value is much higher than is necessary.
    If still issues, try to increase results depth. This will impact latency, but may have influence with errors you are detecting.
    I will check with our QA to see if the material you noted has seen the improved BER screen. However, I don't believe this is related to the BER error.

    Regards,
    Wade
  • Hi Wade, 

    - The histogramming is handled by hardware, so I cannot, at this this give you RAW data. If you think that it could be useful and could solve the problem, I could try to figure a way to extract those data, but I am not sure how long this could take....

    -We already use a RESET before the configuration.

    -Here are the registers value. Please note that we lowered the RCLK frequency before the dump, so it is at 75MHz.

    Register Value
    0x00, 0x20, 0x40, 0x60 0x0003
    0x01, 0x21, 0x41, 0x61 0x0000
    0x04, 0x24, 0x44, 0x64 0x0014
    0x80 0xA020
    0x81 0x0006
    0x82 0x0001
    0x83 0x8010

    -The counter size has no effect on the current problem. We made different acquisition but none of them showed improvement.

    -We changed the result depth to 24 bits, and we noticed that there was a small improvement, since it took a higher SYNC frequency to see the problem appear, but still happens at 8MHz. Changing to higher result depth would require extended FPGA programming.

    I don't know what to do next. Please help me...

  • I did not see any issues with your registers settings.
    Unfortunately, you may have exposed a new errata with the device.
    We do have other customers using with multiple repetitive sync's, but their fastest rate is around 5Mhz.
    Our ability to test this with our existing EVM and automated test equipment does not allow us to expose this.
    Have you confirmed how other channels behave?
    Are you confident in the FPGA processing code?


    Assuming not FPGA processing related and that this is affecting all channels, the only logical solution would be to reduce the sync rate, and use FPGA to adjust timing based on time from last sync.
    Regards,
    Wade
  • Other channels behave in the exact same way....

    I have verified if the error could be in the FPGA deserialyzer, but the error is not linked to any bit error. It sometimes impacts several subsequent bits, which tells me the error occurs before the EVENT minus SYNC calculation... (the +-8/+-16/+-32/+-64 error happens before the calculation, which means inside the TMU).

    Are you planning on finding a way to test this feature to determine if you have the same results? Would you be able to get simulation results from the ASIC designers?
  • The error could be introduced from events, or from sync channels.
    All channels reference same sync, so results would be similar amongst all channels if the lsb's of the sync were getting corrupted.
    From the histogram, it appears that data can be off by +/- the lowest 6 LSBs. These are values generated by each channel (and sync) interpolator. I suspect that it is related to the sync's value due to if affecting all channels similarly and its dependence on sync update rate.

    Unfortunately, we do not have simulation capability for this design. This is one of the prime reasons the device was moved to NRND status.

    If all units experience this behavior, there is no expectation that screening can eliminate potential error.
    Unfortunately our current test and bench capability does not allow this massive amount of data to be taken in one pass and at this high sync rate.

    It is possible that you could try additional units to verify if all show same behavior at high sync rate. However, the best solution would be to lower sync rate and modify results based on calculated sync.

    Regards,
    Wade
  • Thanks Wade.

    Could you provide additionnal free samples so we could test other units, the most recent ones... I could check to assemble new TMU on the existing boards.

    I cannot have additionnal funding since we do not have a working prototype at this time...

    Regards,
    Jonathan
  • Jonathan,
    I will have our Marketing contact you offline to see if we can arrange this.
    Regards,
    Wade