This thread has been locked.

If you have a related question, please click the "Ask a related question" button in the top right corner. The newly created question will be automatically linked to this question.

TMS320F280039C: Setting breakpoints using XDS110

Part Number: TMS320F280039C

Hello, 

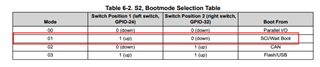
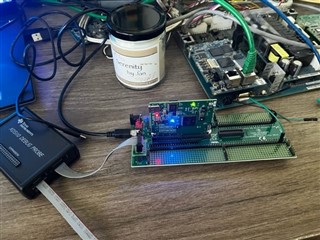
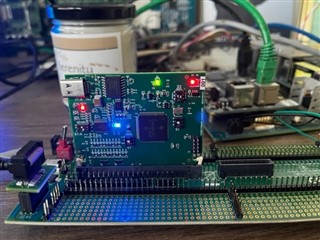
I am having trouble setting breakpoints using XDS110 with the TMS320F280039C evaluation module controlCARD and the HSEC180 controlCARD Baseboard Docking Station. The TMS320F280039C looks to have a built in XDS110 - I have tried it and also have tried setting break points with the external XDS110 plugged into the HSEC180 controlCARD Baseboard Docking Station. Both results are the same - I cannot get break points to work.

When I set the breakpoints in the debugger view I get this error: 

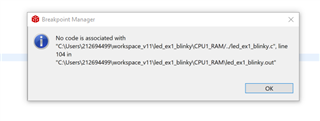
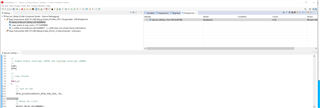
If I go into the editor view and set a breakpoint I no longer get this error but the breakpoints have no action

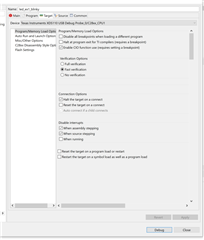
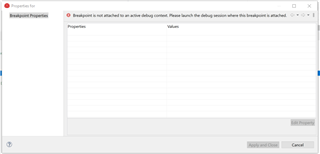
If I right-click on the break point and go to properties I see this: 

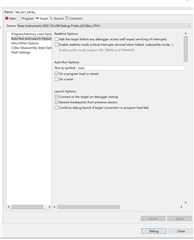
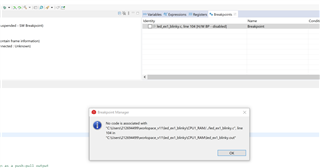
I have also tried to set a HW breakpoint in debug view - I am able to enable this but the code does not halt on it, but as soon as I start a new session it gets disabled with the fault about "no code associated with"

Thanks for your help!

  • Hi Derek,

    Can you check the target configuration? Is it in cJTAG mode?

    Just to make sure, you are connect a USB-C cable to J1:A.  and other end to computer.

    LED1:A and D3 on the controlCARD should illuminate.

    Thanks & Regards,

    Santosh

  • I was able to download the LED1 blinky project to the module and D1 is blinking. However, I cannot set breakpoints in the program. 

    I've tried both USBC cable and also an external XDS110 connected to the JTAG on the baseboard. I assume the configuration is JTAG since I can load the blink project with both USBC and external XDS110. How do I check? Do I need to set up something special to use breakpoints?

  • Derek,

    Are you running in 'Wait Boot' mode? If not, can you try to run in 'Wait Boot' mode?

    Please check the debugger auto-run options and make sure it is configured to run to main:

    https://software-dl.ti.com/ccs/esd/documents/users_guide/ccs_debug-main.html#auto-run-and-launch-options

    Thanks & Regards,

    Santosh

  • Hey Santosh, 

    I had S2 left down, right up. I switched this to S2 left up, right down and now the blinky led program requires me to hit play on a MCU reboot. Therefore it looks like it is now in wait-boot mode. However, still the breakpoints do not work. 

    This is my setup at the moment (I tried both USBC and the external XDS110 and neither allow breakpoints - both load the blinky led project though):

    Current switch config is shown below: 

    These are the target settings 

    Program/Memory load options

    Auto run and launch options

    Misc/Other options

  • Derek,

    What is CCS version you are using?

    Thanks & Regards,

    Santosh

  • Hi Derek,

    Based on the error messages and your second to last screenshot (in your first post) where you set a hardware breakpoint on what appears to be a blank line (line 104), there is some issue with source code correlation. Basically the source you have open in the editor is not associated with the one used to build the program. 

    How is the source file in question being opened. Are you manually opening it or did the debugger open it?

    Thanks

    ki

  • Thanks Ki this is my issue. In other IDEs for other MCU vendors typically you can set breakpoints on empty lines and I typically do this to stop before a function runs. It's a habit I've gotten into. If I set breakpoints on none empty lines they work. Thanks for the help!

  • If you try to set a breakpoint on an blank line in a function, CCS would just set it on the next applicable source line. You screenshot actually showed a hardware breakpoint set (enabled) on a blank line. I'm actually confused as to what happened there