Part Number: TMS320F28379D
Hello,
I am trying to see the grid voltage 50 Hz signal in the graph tool in code composer studio. somehow I am able to see the constant value but not the sinusoidal quantity. Kindly find my graph settings as in the image attached. I have the breakpoint on the quantity inside the ISR, running at 32kHz.
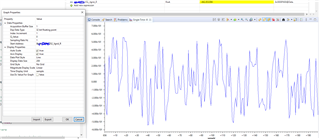
I tried changing different sampling rate but didn't help it. Kindly help.