This thread has been locked.

If you have a related question, please click the "Ask a related question" button in the top right corner. The newly created question will be automatically linked to this question.

TMS320F28335: FFT example graph plotting

Part Number: TMS320F28335
Other Parts Discussed in Thread: CONTROLSUITE

We are trying to execute FFT experiment from controlSuite/lib/FPU/v1.4/x28335_RFFT

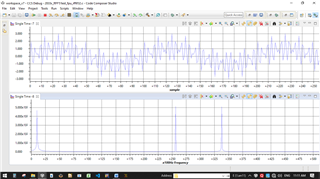
a) when i use Ti's RFFT code, why its magnitude & frequency graph on CCS isn't sharp? Where some sort of equiripple type waves are seen?

b) If you use FFT plot of CCS then its output magnitude vs frequency is very sharp. In what may built in CCS code is superior? Please explain.

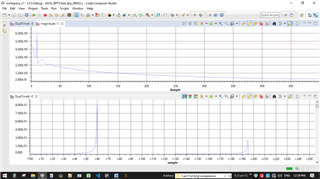
Following screenshots are graph results of RFFT we are using. where DualtimeA-0 is input array RFFTin1Buff, DualtimeB-0 is output array RFFToutBuff, magnitude-1 is magnitude array RFFTmagBuff. 

radstep is set as 10KHz sin frequency. 

  • As far as I understand, RFFTIn1Buff contains time domain data, RFFToutBuff contains FFT data (complex, frequency domain), and RFFTmagBuff contains FFT magnitude data.

    1. So if you plot RFFTInBuff in CCS using "Single time", you will see the time domain signal.

    "Dual Time" just allows you to plot 2 waveforms.

    2. If you plot RFFTOutBuff in CCS using "Single time", I don't think it will plot anything meaningful.

    3. If you plot RFFTmagBuff in CCS using "Single time", you will see the FFT magnitude plot.

    4. If you plot RFFTInBuff in CCS using "FFT magnitude", you should see something similar to (3) above.

    If there are differences, it may have to do with the Properties set in the "FFT" property window of CCS.

    Thanks,

    Sira

  • Thank you,

    I resolved the issue of 'non sharp' plot by changing "RFFT_STAGE" value from 8 to 10 in main file. It gives sharp spikes when RFFTmagBuff is plotted on SingleTime-8 graph. However there is another issue,

    X- axis of SingleTime-8 graph shows in sample and not in Frequency. Yet the sample no. matches with Frequency value if sample no. x 100Hz etc.

    Following screenshots are graph results of RFFT, where SingleTime7 is RFFTin1Buff, SingleTime-8 is RFFTmagBuff, I tried to change SingleTIme-8 X-axis name to "x100Hz Frequency". 

    Why we have to do this?

    i) Please throw light on meaning of "RFFT_STAGE" number. How it is related to FFT formula? 

  • RFFT_STAGE represents the number of FFT stages, so changing it from 8 to 10 means your are increasing the FFT size from 256 to 1024.

    The x axis of RFFTmagBuff is going to have the RFFT magnitude on the y axis, and the "frequency bin number" in the x axis. This is just going to be an Integer (not the actual frequency) from 0 to N-1, where N is the FFT size. Furthermore, since this is the FFT of a real signal, the magnitude is going to have symmetry around N/2, which is why the number of unique magnitude values in RFFTmagBuff is N/2 (=512 when RFFT_STAGE = 10).

    Thanks,

    Sira

  • Dear sir,

    Can you explain in more details your last paragraph of your replay. 'Frequency bin number', FFT size, etc. If i reduce stage to 8, then i still get spikes at same frequency but position on x-axis does not match with sample no. Why? Explain in detail.

    Thank you,

  • Yes, this is FFT theory. I have added some personal notes below. If you want to get a deeper understanding, you will have to do some self study on this topic.

    Thanks,

    Sira

  • I appreciate your generosity.

    However I am still trying to figure out what is FFT stage? a block of bins?

  • IF you have a 256 (=2^8) point FFT, it will have 8 stages of execution from input to output.

    If you have a 1024 (=2^10) point FFT, it will have 10 stages.

    Thanks,

    Sira

  • Observe FFT plot image attached below,

    1. SingleTime-0 shows composite sin of 1+33KHz. where SingleTime-1 shows spike at 330th sample or bin. Please explain from where this x10 coming? It should have been 33rd sample or bin.

    FFT stage is 10

    SingleTime-1 = RFFTin1Buff

    SingleTime-2 = RFFTmagBuff

  • I copied the RFFTF32Coef array from CCS debug mode and pasted into Microsoft Excel to observe and plot the graph (attached below).

    It shows up an enclosed, why there are many symmetries? please explain.

    FFT_stage = 10

    X-axis 

    From    To

    54        119   -> shortest isosceles triangle

    255      500  -> large isosceles triangle

    500     1024 -> Largest isosceles triangle

  • This goes back to the bin number and its relationship to the analog frequency. It depends on the sampling frequency used as well as the size of the FFT.

    f/fs = k/N

    f = fs (k/N), where f is analog frequency, fs is sampling frequency, k is bin number, N is FFT size

    Your observations in the graph associate 1kHz with bin 10, and 33kHz with bin 330. Therefore, 

    1 = fs (10/1024) (in kHz)

    33 = fs (330/1024) (in kHz)

    So this is consistent, and it tells me fs ~ 100kHz in your use-case.

  • On the RFFTf32CoefArray question - Now you are getting big time into FFT theory :) and this is something you're going to have to read up yourself. There is enough literature available online for this.

  • Thanks, but you will get some credit by alleviating my dyslexia if you share some crucial insight by explaining above. Already you have shared some cryptic notes of yours in your replay on dt. 9 june 2023 which partly you have repeated in your last reply.

    Is it something to do with aliasing/ sampling frequency etc?

    I solicit your insight full comments.

  • The following is from RFFT_f32_sincostable.c within the FPU DSP library.

  • Well, all my questions have originated based on the file you have attached, When i try to print this array on my Excel, I got above isosceles triangles. In what way isosceles triangles represent euler's equation/ Twiddle factor in FFT. Please help

  • I have asked an expert on this to review and provide any guidance.

  • What I was told (pasted below) is the same as what we already know:

    The twiddle factors are quite straight forward.

    For k = 0 to N-1,

    e^((-2*pi*j*k)/N)

     You can plot in Matlab or C and see the values of the cosine and sine terms separately.

  • Thanks,

    Please help me to correlate variables k, N from above formulae with "FFT_Stage" as mentioned 2/3/4, 5, 8, 10, etc in above sin cos table. whether each stage is to be read separately or stage 5 encompasses stage 2/3/4?

    Mostly later seems to hold if you limit the printing of table to stage 2/3/4 further isosceles triangles are not there.

  • Please help me understand what you are trying to gain from this exercise.

    Our FFTs work and their outputs match outputs generated using MATLAB.

    Admittedly I have not performed a detailed analysis of the FFT twiddle factor coefficients and what their shape is. You are welcome to do so.

    If you have any questions specific to our software, I am happy to help you. If you generic questions, it would be your responsibility to investigate and learn.

    Thanks.

  • We appreciate your position, however we have tried to pose questions relating to your software & its idiosyncrasies while there could be some side questions concerning definitions/formulae used there in. If we want to bootstrap our product development using some of your ready made codes we may need there answers which you may choose to reply depending on how gregarious are policies of TI. 

  • I'm happy to help where I can, I just don't have the expertise to answer the question you posed i.e. regarding the specific shape of the twiddle factors.

  • Where can i get ready example of image processing using 28335?

  • Hello,

    Image processing is not a typical application for C2000 MCUs, so we don't have such an example available.

    Thanks,

    Sira