This thread has been locked.

If you have a related question, please click the "Ask a related question" button in the top right corner. The newly created question will be automatically linked to this question.

TMS320F280039C: Debug MCAN with step-by-step trace

Part Number: TMS320F280039C

Dear Champs,

I am asking this for our customer.

Is it possible to use CCS breakpoints/step-by-step code trace for MCAN ISR while transmitting TX buffer data?

If yes, how does the user do it?

The user can run MCAN successfully without breakpoints/step-by-step code trace, but the user fails to run MCAN with breakpoints/step-by-step code trace, which means that PCAN cannot receive data and the logic analyzer gets the wrong decoded data.

  • Hi Wayne,

    The examples for MCAN transmission basically configures the TX message object, writes the message object to Message RAM, initiate a transmission request then poll for an acknowledgement..  I think user can set a breakpoint before TX message configuration, and can step through right until writing to message ram, but code has to be run continuously, not stepping through starting with the transmission request (with MCAN_txBufAddReq function) right up to the polling for acknowledgement (with MCAN_getTxBufReqPend function).

    Regards,

    Joseph

  • Dear Joseph,

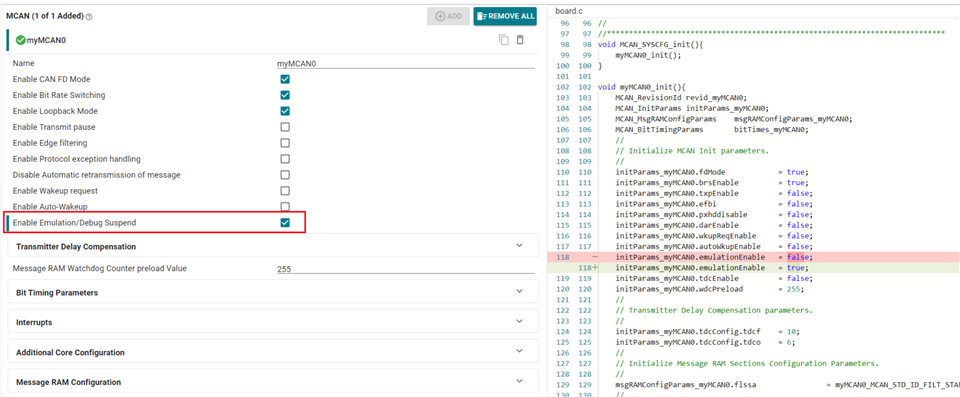
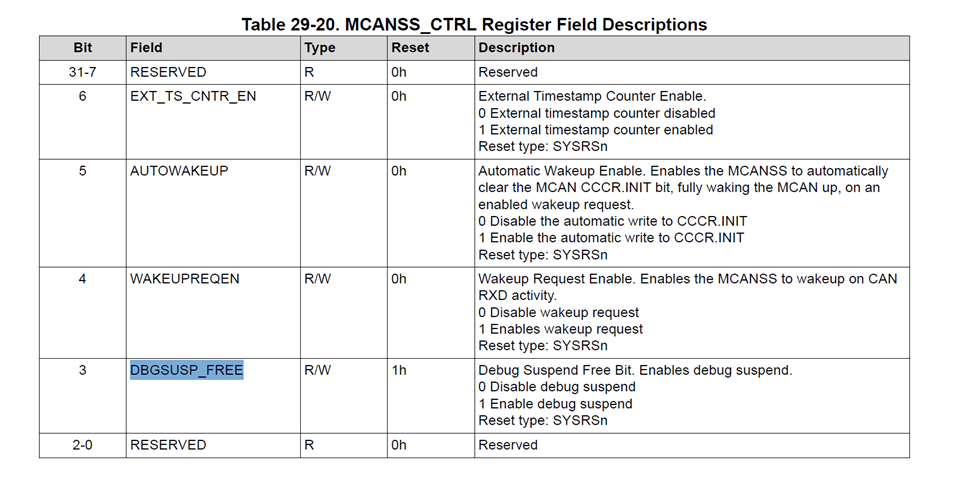
    Should the user leave this bit MCANSS_CTRL.DBGSUSP_FREE enabled or disabled in this case or it does not matter?

    The user wonders if and how this bit MCANSS_CTRL.DBGSUSP_FREE matters for debugging like breakpoints.

  • Hi Wayne,

    I don't think that it would help.  Based on the bit description, if DBGSUSP_FREE is set, it puts the MCAN module in suspend mode whereby MCAN clock is stopped.

    When clock is stopped, user will not be able to step through the code.

    Regards,

    Joseph