TMS320F28335:f28335(ccs code running problem):The results of single-step and continuous running of the ccs program are inconsistent

Part Number: TMS320F28335

Tool/software:

When I ran the code generated by psim2024, I found a strange problem. The results of single step and continuous operation of ccs program are inconsistent!

As shown in the figure, I9=(I1-2.5)*20, I14=I9 in my program, the result of continuous running is completely wrong, and the result of single step running when the breakpoint is set is correct.

ps: 

1.  I didn't turn on compiler optimization

2. The data is of float type, and the error is independent of the data type

3. Using the volatile keyword to modify data is also ineffective

Other conditions are as follows:
Emulator: XDS100V1
Controller: f28335
ccs version: ccs6.1.3

  • I would like to add a little information: my program has always had a warning after compilation, because it does not affect the operation of the program, so I ignored it, as follows:
    1. #10063-D entry-point symbol other than "_c_int00" specified: "code_start"
    2. #99922 C:\Users\licai\AppData\Local\Temp\023602: Invalid CIE reference 0xffff0000 for the FDE at offset 0x00000192 in the .debug_frame section()
    3. Build variable 'XDAIS_CG_ROOT' cannot be resolved.
    4. Invalid project path: Include path not found (\packages\ti\xdais).
    Will these warnings affect the correctness of my program?

  • Hello,

    I suspect you are running into a known issue:

    https://sir.ext.ti.com/jira/browse/EXT_EP-10722

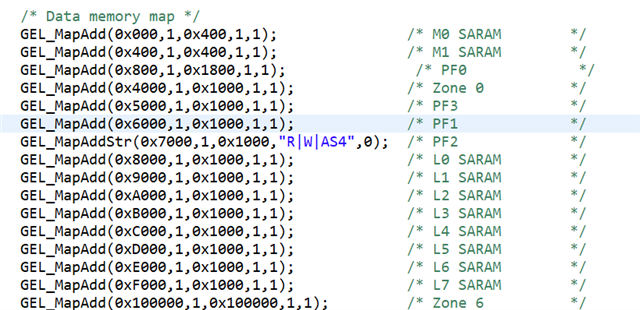
    Please check the debugger memory map and see if the access size is set to AS2. If so, you can set it to AS4 as mentioned in the above link.

    Thanks

    ki

  • Hello,

    Your answer would be appreciated

    I changed the only AS2 in gel file to AS4, but the problem still hasn't been solved.

    Meanwhile, I would like to confirm a question, that is, will this only affect the observed value in the watch expression window, or is my real value also wrong?

    Thanks

  • I made two other discoveries

    1: When I do not power the sampling circuit, i.e. fGblI1 is 0, the result is correct in continuous running, and wrong once the sampling circuit starts working.

    2: When the sampling circuit is working, the continuous running data is not correct, the data will be updated after a pause (expression background shows yellow), the result is correct, and the correct result is kept unchanged during continuous running

  • I changed the only AS2 in gel file to AS4, but the problem still hasn't been solved.

    I noticed that you changed the access size for PF2 which is 0x7000 - 0x7FFF

    However the variables you show are at address 0x9E**. Hence it looks like you need to change the access size for L1 SARAM instead.

    ccs version: ccs6.1.3

    Also, please note that you are using a very old and unsupported version for CCS. I suggest updating to a current version.

  • I upgraded ccs to the latest version, the problem still exists.(There's no problem with checking "halt the target before........") If it is convenient, could you please explain in detail how to change the access size of L1 SARAM?

    Meanwhile, I would like to confirm a question, that is, will this only affect the observed value in the watch expression window, or is my real value also wrong?

  • If it is convenient, could you please explain in detail how to change the access size of L1 SARAM?

    It is the same as how PF2 is configured in your screenshot. Do the same for L1 SARAM using GEL_MapAddStr

    will this only affect the observed value in the watch expression window, or is my real value also wrong?

    The watch expression is showing the incorrect value because it is reading two halves of a float value at different times. This is not a problem when the target is halted. But when doing real-time access with continuous refresh the watch expression can show an "in between" value where only one half is updated.

  • I'm sorry for taking so long to reply you due to a business trip.

    Now I can confirm that it is not the debugger memory map that is causing the problem, but the delay. But problems remain

    The following is the ccs program framework for PSIM generation:
    Interrupt void Task()
    {
    ................
        delay_MS(10ms) // This is correct only if the delay is added here
        fADC3 = PSM_AdcGetValBySoc(0) * (1 * 3.0/4096); // Get DC value from ADC_A0.
        fADC3_1 = PSM_AdcGetValBySoc(1) * (1 * 3.0/4096); // Get DC value from ADC_A1.
        fADC3_2 = PSM_AdcGetValBySoc(2) * (1 * 3.0/4096); // Get DC value from ADC_A2.
        fADC3_3 = PSM_AdcGetValBySoc(3) * (1 * 3.0/4096); // Get DC value from ADC_A3.
    ...............
    }
    ////////////////////////////////////////////////////////////////////////////////////    The interrupt service routine for 20 kHz. It is called in every 20-kHz cycle.


    void Initialize ()
    {
    ...

    ////////////////////////////////////////////////////////////////////////////////////    The initialization routine. It initializes hardware.


    void main ()
    {
        Initialize();
        PS_EnableIntr(); // Enable Global interrupt INTM
        PS_EnableDbgm();
        for (;;) {
        }
    }

    ////////////////////////////////////////////////////////////////////////////////////   The main program. It calls the initialization routine, and runs an infinite loop.

    The program can run correctly only when a delay is added before the digital-to-analog conversion in Interrupt void Task(), but only when the delay is more than 10ms. However, this delay is too long for my switching cycle, leading to problems in my closed-loop feedback. What should I do to solve it?

  • Now I can confirm that it is not the debugger memory map that is causing the problem

    Did you try changing the attributes for the correct memory range?

    I ask, because:

    The program can run correctly only when a delay is added before the digital-to-analog conversion in Interrupt void Task(), but only when the delay is more than 10ms. However, this delay is too long for my switching cycle, leading to problems in my closed-loop feedback. What should I do to solve it?

    The original issue regarding the debugger memory map can result in a timing issue. Like the one you mention about. The issue is that if the default 16-bit access size is used for the memory range, then the memory read for the variable value is done in two operations and on a running device, depending on the timing, the value may change in the middle of these two operations resulting in an invalid value for the variable. Slowing the system down with a delay would lessen the odds of this happening and resulting in the variable displaying the correct value.

    Everything you describe is in line with the prior issue I mentioned. Hence I would like to confirm if you did set the correct access size for the correct memory range.

    Thanks

    ki