TMS320F280049C: Sampling Rate of Real-Time Debugging on C2000

Guru 10680 points
Part Number: TMS320F280049C
Other Parts Discussed in Thread: SYSCONFIG, C2000WARE, LAUNCHXL-F280049C

Tool/software:

Hi,

I am currently working with the C2000(F280049C) and would like to inquire about the sampling rate capabilities of its real-time debugging features.

Specifically, I am interested in understanding the maximum achievable sampling rate for real-time monitoring and debugging using JTAG-based debugging tools such as XDS110, XDS200, and XDS560v2.
Could you provide details on:

  1. The maximum sampling rate for real-time variable monitoring in Code Composer Studio (CCS).
  2. The performance differences in sampling rates between JTAG-based real-time debugging when using different debuggers (e.g., XDS110, XDS200, XDS560v2).

The background to the question is that with other companies' MCUs, real-time debugging at a few MHz can be achieved using J-Link. Since our application requires high-speed monitoring debugging of variables, it is very important that this function can be implemented in C2000.

Thanks,

Conor

  • Hi Conor,

    The maximum sampling rate for real-time variable monitoring in Code Composer Studio (CCS).

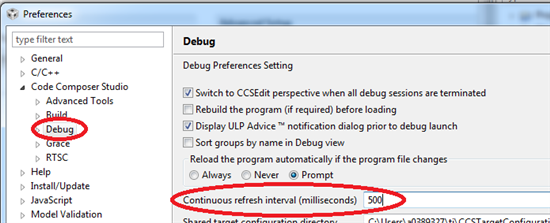
    The default refresh rate of the views is 500 ms. The maximum data rate is limited by SW to 100 ms, but this only happens under ideal conditions (fast debug probe, lightweight PC load, etc.). Please see this Graph tools guide for more details.

    The performance differences in sampling rates between JTAG-based real-time debugging when using different debuggers (e.g., XDS110, XDS200, XDS560v2).

    This page should help give some concrete numbers for emulator speed, with test cases specifically done on the F280049C.

    Most/all of these metrics are looking at code download speed, as well as single stepping. I would think the step number would have some correlation to the real time performance.

    Best,

    Matt

  • Hi Matt,

    The real-time debugging feature can only acquire data at a maximum rate of 10Hz, making it unsuitable for data collection in the kHz or MHz range.

    We are currently investigating methods for high-speed data logging using the C2000.

    Do you have any ideas or suggestions?

    Thanks,

    Conor

  • Hi Conor,

    There are a few options:

    • Debug Server Scripting (DSS): http://software-dl.ti.com/ccs/esd/documents/ccs_automated-testing.html  
    • Use the Data Transfer module in SysConfig (currently in beta for C2000Ware 5.03 and more recent) to sample and log data using a communication peripheral (SCI, SPI, UART, FSI, or USB). The max speed depends on the communication peripheral (but are definitely faster than JTAG), you can look at the TRM to see the max transfer rate. If you're interested in this option, I can provide more details as there is example code available.

    Best,

    Matt

  • Hi Matt,

    Debug Server Scripting (DSS)

    When I checked the page, I found that it explained how to perform automated testing using CCS, but I could not find any specific methods or implementation examples for high-speed data logging. Can we achieve what we want by using the scripting tools and APIs built into CCS?

    • If you're interested in this option, I can provide more details as there is example code available.

    Yes, I'm interested. Can you please let me know the maximum data rate using the sample code and each peripheral?

    Thanks,

    Conor

  • Hi Conor,

    For the F28004x, the maximum communication speeds for each (available) peripheral are the below:

    SCI(UART): 6.25 MHz

    SPI: 25 MHz

    FSI: 100 MHz

    In order to visualize the data exported by the Data Transfer module on your PC, you will need a bridge device to convert each of the communication protocols to USB. If using a TI LaunchPAD or controlCARD, there is a built-in UART-to-USB bridge on the boards. If you wanted to use FSI for example, you'll need to connect another bridge device to convert FSI-to-USB. You can use the Transfer bridge module in Sysconfig to easily generate the needed software for the bridge device as well.

    Example code can be found in the C2000ware path: [C2000ware install]/driverlib/f28p65x/examples/c28x/transfer/transfer_customlog_export_sci. I'm not sure why the transfer examples are missing from the F28004x folder, but the SCI module is the same on both devices so you should be able to use the same code.

    Best Regards,

    Delaney

  • Hi Delaney,

    I checked the sample code based on your comment.

    System Configuration

    Custom F280049C Board (Transmitter)

    Implements code similar to transfer_raw_fsi_tx.c, transmitting variable data via FSI (Fast Serial Interface).

    LAUNCHXL-F280049C (Bridge Device)

    Uses transfer_comslogger_export_sci.c to receive data via FSI and forward it to the PC via SCI (UART).

    PC (Visualization)

    Receives data via UART (USB) and displays it in real-time using GUI Composer or other tools.

    Questions

    Q1. Confirmation of System Setup

    With this setup, we assume the connection will be:

    "F280049C (Custom Board) → LAUNCHXL-F280049C → PC"

    Is the above understanding correct?

    Q2. How to View Data on the PC GUI?

    We would like to understand the specific steps required to visualize the data sent via UART on the PC GUI.

    Could you provide details on the following aspects?

    • SysConfig setup procedures
    • Required processing steps for visualization in GUI Composer
    • Recommended data format (Binary / ASCII / JSON, etc.) for optimal performance

    Q3. High-Speed Monitoring Without FSI

    If my understanding of Q1 is correct, implementing FSI on a custom board will require layout changes.

    However, since the custom board already has SCI (UART) and JTAG, we would like to explore whether it is possible to monitor variables in real-time without adding FSI.

    Could you suggest any alternative methods, such as:

    • Using only SCI (UART) for high-speed data transmission
    • Utilizing JTAG (DSS: Debug Server Scripting) for real-time variable monitoring

    Thanks,

    Conor

  • Hi Conor,

    With this setup, we assume the connection will be:

    "F280049C (Custom Board) → LAUNCHXL-F280049C → PC"

    Is the above understanding correct?

    Yes, that would be the correct setup. You just need to wire the FSI pins from the custom board to the F28004x LaunchPAD and then you can plug the LaunchPAD into your PC.

    We would like to understand the specific steps required to visualize the data sent via UART on the PC GUI.

    Could you provide details on the following aspects?

    • SysConfig setup procedures
    • Required processing steps for visualization in GUI Composer
    • Recommended data format (Binary / ASCII / JSON, etc.) for optimal performance

    To use the GUI, you should be able to set the GUI_SUPPORT project property in the bridge project (LaunchPAD) to 1, then build the project in CCS. After that, you can run the project on the device (either by connecting the debugger + running or flashing the project itself), then launch the GUI from View -> GUI Composer -> Applications -> transfer_comslogger_export_sci and see your logged data.

    Also, let me talk with the other expert on this and see if we can get you an example made for F28004x so you can run the example without any further steps. I'm not sure what the reasoning is behind the F28004x examples being left out of the C2000ware package.

    For optimal performance, you will probably want to use the START/END package mode (set in the Exporter Sysconfig module), although I would start with JSON first to get it working so that you could potentially debug the messages in the COM port if needed (JSON format is more human-readable). 

    Once you have the example working, the steps for adding this support into an existing project (that already has Sysconfig) would be the following:

    1. Add the same selections in Sysconfig as are done in the example on each device's project
    2. On the transmitter device: write the FSI TX buffer with the data to be transmitted and start a transmission (this can pretty much be done anywhere in your application - FSI transmission speeds are very fast so you shouldn't see it effect performance).
    3. On the bridge device: Enable the build configuration for the GUI support and build/flash the example code

    If my understanding of Q1 is correct, implementing FSI on a custom board will require layout changes.

    However, since the custom board already has SCI (UART) and JTAG, we would like to explore whether it is possible to monitor variables in real-time without adding FSI.

    Could you suggest any alternative methods, such as:

    • Using only SCI (UART) for high-speed data transmission
    • Utilizing JTAG (DSS: Debug Server Scripting) for real-time variable monitoring

    If you wanted to use this tool with SCI on a custom board, you would just need to wire up a UART-to-USB bridge to the SCI pins (you could for example use a simple FTDI chip). For this method, you could use the transfer_customlog_export_sci example/ instead.

    JTAG isn't high speed enough to monitor variables in real-time for most applications as far as I know.

    Best Regards,

    Delaney

  • Hi Delaney,

    Thank you for the detailed review.

    Also, let me talk with the other expert on this and see if we can get you an example made for F28004x so you can run the example without any further steps. I'm not sure what the reasoning is behind the F28004x examples being left out of the C2000ware package.

    I look forward to hearing the results of your discussion with the experts.

    Thanks,

    Conor

  • Hi Conor,

    It looks like this example is missing from C2000ware by mistake. One thing I forgot to mention is the examples are all in universal project format, meaning you should be able to easily convert each example between device families in Sysconfig. Can you try the following:

    1. Import one of the examples in another device's transfer/ folder
    2. Launch the Sysconfig file (.syscfg)
    3. Click on the three dots -> Preferences & Actions in the top right
    4. Click the SWITCH button
    5. Select your F28004x device in the Device dropdown + Confirm
    6. Now the project should be converted to F28004x

    If you have any issues with this, I can also try to put together a patch for C2000ware with the examples for F28004x.

    Best Regards,

    Delaney

  • Hi Delaney,

    I have summarized your views.

    ==================================================================================================
    - To monitor variables in real time on the F280049C on a custom board, you can use the transfer tool in SysConfig.

    - The debug constraints in the transfer tool depend on the peripheral. For example, SCI (UART): 6.25MHz, SPI: 25MHz, FSI: 100MHz.

    - The hardware setup is F280049C on a custom board → LAUNCHXL-F280049C → PC.

    - If you want to communicate via SCI, you can refer to the transfer_customlog_export_sci sample code for the settings.

    - To enable data logging on the C28x device, go to Build -> Variables and set the value of GUI_SUPPORT to 1.

    In the sample code, "Logging entry 1" is sent via UART (SCI) as shown below, and logs are sent every second. By changing DEVICE_DELAY_US() in this code, real-time monitoring up to several MHz is possible. However, this means that CPU resources are concentrated in the UART, so it is questionable whether it can be incorporated into the current application code. Also, taking into account the accuracy of the EVM crystal, how fast can debugging actually be achieved?

    ----------------

    while(1)
    {
    DEVICE_DELAY_US(1000000); // Wait 1 second

    // Send log using UART (SCI)
    EXPORTLOG_log("Logging entry 1");
    EXPORTLOG_log("Next log entry 2");
    EXPORTLOG_log("last entry 3");
    }
    ----------------

    This allows you to debug the variables of the F280049C on a custom board in real time.
    ==================================================================================================

    Is my understanding correct? I would like you to explain in detail the part in red in particular.

    Thanks,

    Conor

  • Hi Delaney,

    Do you have any update?

    Thanks,

    Conor

  • Hi Conor,

    I'm sorry for my delayed response. This code is just an example of the functions you can call to export data via SCI. In a normal application, you wouldn't have the delay; you can just send the data out wherever you want in your application. 

    Can you explain your application a little bit? Is most of the execution done in the main program loop or in interrupts?

    This example is primarily useful for code utilizing an interrupt driven approach for high priority code and executing lower priority code in the main loop. Depending on where/how often you call the EXPORTLOG_log() function, the CPU may be blocked waiting on space in the SCI FIFO, which would be the main CPU performance concern. Usually, the function can be called in the main loop so that it doesn't interfere with any high priority execution. 

    The speed of the debugging messages would be dependent on the SCI baud rate set, which you can modify in Sysconfig. It wouldn't necessarily be exporting in "real-time" for this example. The FSI examples would be closer to a "real-time" performance. We are still working on doing some benchmarking of the tool to give exact performance numbers for each configuration. 

    Best Regards,

    Delaney