This thread has been locked.

If you have a related question, please click the "Ask a related question" button in the top right corner. The newly created question will be automatically linked to this question.

TMS320F280039C: Can not read CAN message objects in RAM when in debug mode

Part Number: TMS320F280039C

Tool/software:

Hello,

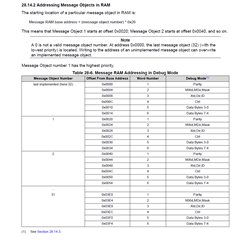
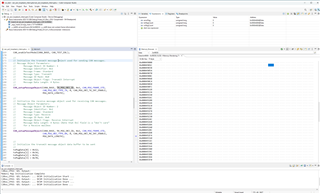
I am following through the can_ex2_loopback_interrupts example. I have read through the TRM and understand that only in debug mode can I access the message objects in RAM. I am using 280039c launch pad and I can see this example working by reading the CAN data through PEAK-CAN dongle. However, as I am trying to understand more into the data mapping in message objects, I set a break point after I call CAN_sendMessage function. Ideally I should see the message objects updated to the data I want to send, my Tx message object number is 1, so the address should starts at 0x49020, and I want to read the 0-3 data, so it should be 0x49030. But as you can see in my memory browser window, I am not able to see any data, please advise me on how to read message objects in debug mode, thanks.

Best,

Kai
  • Hi Kai,

    Reading directly from RAM memory is not recommended for CAN message objects since the memory browser would seem to jumble the data because of the data bridge interface.  The recommended method is to read the object contents through the interface register.  Use API CAN_transferMessage() first to transfer the CAN message RAM data to the CAN Interface registers then use API CAN_readMessage() to read out the message contents through data structures that are passed to the CAN_readMessage() function.

    Regards,

    Joseph

  • Hello Joseph, 

    Thanks for the reply. I am following technical reference manual 28.14, and it mentions that only in debug mode can we access message object memory sections, and I believe there are several threads showing people can really do it. I am just curious why even if I am in debug mode, I am not able to view my message object in memory browser, thanks much.

    Best,

    Kai

  • Hi Kai,

    For F280039 device, it is intentionally not exposed since data is mirrored and recommended way to view is per what I outlined above.  Displaying the CAN message RAM in memory browser is possible by modifying the GEL file as shown in the attachment however, it may not be usable and confusing for your debug.  To edit the gel file, go to Tools->GEL File.  In the GEL Files dialog box, double click the gel file so the contents will appear at the editor then add the entry that is highlighted in the snapshot.  This will expose the message RAM region in the memory browser.  Save upon editing then unload/reload the gel file in the dialog box and power cycle the board and reconnect.

  • Hello Joseph, 

    Thanks for the reply, after I modified the GEL file, I can see the message RAM for CAN in debug view now. I am wondering why isn't this being documented in technical reference manual? Because on the manual it does not specify this additional steps. In addition, may I know what is the GEL file and what is it usage? Thanks much

  • Hi Kai,

    As mentioned in my earlier post, using the driverlib APIs to monitor the contents of the message RAM is the recommended method, not through physical examination of the memory-mapped location due to bridging issues hence this step is not documented.  For the GEL file, you can find more on this by searching past E2E posts under Code Composer Studio.

    Best regards,

    Joseph