This thread has been locked.

If you have a related question, please click the "Ask a related question" button in the top right corner. The newly created question will be automatically linked to this question.

F29H85X-SOM-EVM: Debug session for F29H85X-SOM-EVM with the code composer studio

Part Number: F29H85X-SOM-EVM

Tool/software:

Having a really difficult time starting a debug session for F29H85X-SOM-EVM with the code composer studio.
I've compiled a pretty large project and when I try to launch a debug session after initial board power up - the debug session starts but the CPU never stops in the "main" function, always showing as "RUNNING". No matter how many times I try to start a debug session with my project I never succeed in getting the debugger operational.

Here is the catch - If I load a small trivial example, the debug session starts fine.
Once debug starts for a small project I can then switch to my large project (as long as I dont power cycle the board), then right click on "CPU1->Reset CPU" then load my larger application and the debug session starts fine after that.
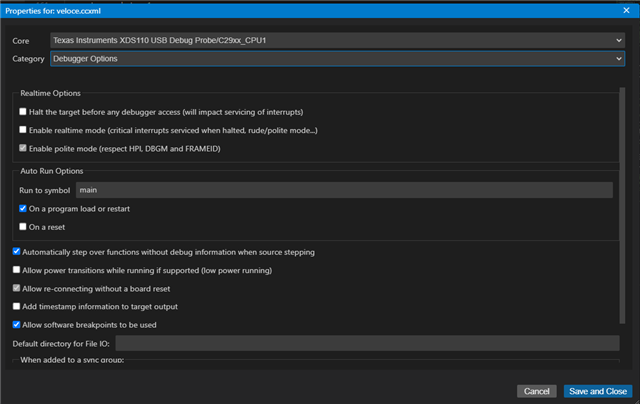
It seems to me like there is some sort of race condition in emulator/cpu logic that prevents normal operation for a large code base ?  Or perhaps there is some setting in the emulator config file or project file that can be adjusted, I tried all possible permutations of options in "Properties->Debug" but nothing seems to fix the loading/debugging issue above.
I'm using CCS 20.2.0. As far as I see CCS 18 does not support C29 architecture.
I tried to recreate project from the scratch with the same result - debugging/running is not possible
I tried to extend small example with the code from large project - same result - debugging/running is not possible
Obviously linker cmd file needs to have more RAM allocated to the ".text" section to load larger code, so i changed the line
.text         : {} > SRAM_LPAx |  SRAM_LDAx
Nothing changes in startup/debug when i try to use SRAM_CDAx instead of SRAM_LDAx
  • when I try to launch a debug session

    There are different ways to start a debug session. Here I assume you are right clicking on the project and selecting "Debug Project"? If so, CCS will start a debug session using the default target config file (ccxml).

    Once debug starts for a small project I can then switch to my large project (as long as I dont power cycle the board), then right click on "CPU1->Reset CPU" then load my larger application and the debug session starts fine after that.

    This sounds your small CCS project has a "correct" target config file, and your larger project does not. I suggest comparing the target config files in both of your projects. You can also start a project-less debug session by right clicking on the working target config file. Once the debug session starts, you can load the .out from which ever project you like. 

    I'm using CCS 20.2.0. As far as I see CCS 18 does not support C29 architecture.

    Correct, CCS 20 and above supports F29 devices. 

  • Target config is identical. In fact it's a copy from the small project. If I try to project less debugging after I load the program it goes into "Running program" state and ignores any breakpoints set.

    These are pretty basic steps and all have been tried before raising an issue.
    Just to cover more bases, same behavior is observed on MacOs version of the CCS and Windows.
  • If I try to project less debugging after I load the program it goes into "Running program" state and ignores any breakpoints set.

    You are able to start a project-less debug and connect to the CPU? What is the status of the CPU at this point? Before you load any program? 

    https://www.ti.com/video/6369936052112 

  • Also, can you clarify which version of the F29 SOM EVM you have? It'd be a good sanity check to review the list of EVM known issues just to rule out the EVM HW as being the source of the problem. 

    The EVM revision and assembly can be determined by markings on the printed circuit board (PCB). The EVM revision is indicated by a silkscreen label such as "MCU144A", where "A" is the EVM revision. The EVM assembly is indicated by a decal on the board such as "-001". 

    https://www.ti.com/lit/ug/spruje4d/spruje4d.pdf 

  • Boris,

    In addition to Gus’s questions, could you confirm the boot mode configured on the SOM and this is a single core project? 

    Do you have the appropriate debugging settings for project auto-run, program load, and misc settings. You can refer to section 7.2.3 https://software-dl.ti.com/ccs/esd/documents/users_guide_ccs_20.1.1/ccs_debug-main.html 

    Best Regards,

    Aishwarya

  • This is a single core CPU1. EVM is MCU144A. SOM is configured to flash boot, however flash is unprogrammed, both projects built with RAM linker script.

  • I've compiled a pretty large project and when I try to launch a debug session after initial board power up - the debug session starts but the CPU never stops in the "main" function, always showing as "RUNNING". No matter how many times I try to start a debug session with my project I never succeed in getting the debugger operational.

    Hi Boris,

    When the CPU ends up in this state. Are you able to run the following Scripts? You can check the CPU Reset Cause, Mission clock detection, ESM_CPUx, ESM_SYS, Error Aggregator statuses. Can you also verify if you're debugger properties -> Category "Debugger Options" -> Auto Run Options are set to run to symbol 'main'? By any chance can you probe the XRSn pin to see if your device is being reset?

    Best regards,

    Ryan Ma

  • Debug run to main is set correctly, exactly as on the screen shot:

    C29xx_CPU1: Executing On Target Connect Functions
    C29xx_CPU1: The connected device is F29H850TU9
    C29xx_CPU1: Watchdog Timer Disabled
    C29xx_CPU1: Memory Map Initialization Complete
    C29xx_CPU1: Here.

    C29xx_CPU1: Device Ready
    C29xx_CPU1: M0 RAM initialization complete.

    C29xx_CPU1: CPU2/3 is held in reset.

    C29xx_CPU1: CPU is in Main code.
    C29xx_CPU1: CPU2/3 is held in reset.

    C29xx_CPU1: File was loaded successfully. -0-
    C29xx_CPU1: Full load.
    C29xx_CPU1: ResetCauses =  XRSn
    -----------
    Checking interrupt status:
    C29xx_CPU1: ResetCauses =  XRSnC29xx_CPU1: CPU State :
    C29xx_CPU1:     INT Enable : 0
    C29xx_CPU1:     Interrupt Status : Main code
    C29xx_CPU1:     NMI Flag : 0, RTINT Flag : 0, INT Flag : 0
    C29xx_CPU1:     INTSP : 0, CURRSP : 1
    C29xx_CPU1: PIPE State :
    C29xx_CPU1:     INT/RTINT Enable       : 0
    C29xx_CPU1:     Current context        : 0
    C29xx_CPU1:     Supervisor INT Enable  : 0
    C29xx_CPU1:     RTINT Threshold        : 0
    C29xx_CPU1:     Nesting group Mask     : 0xFF
    C29xx_CPU1: Pending interrupts in PIPE :
    C29xx_CPU1: Interrupt Status Check Done
    CPU is being reset, we do see transition on XRSn during power up in addition when JTAG debug initiated there are pulse on XRSn line 
  • Hi Boris,

    Can you also provide the ESM_CPU1/ESM_SYS/Error aggregator status? 

    Understood, looks like something is causing CPU1 to be reset, maybe watch dog not being serviced? 

    Best regards,

    Ryan MA

  • Not sure who is supposed to be the servicing watchdog ? It's a blank CPU and application is launched in debugger, I assume JTAG/GEL supposed to stop CPU and disable watchdog, otherwise I don't see how it can be possible to do without initially loading something to the CPU.

    Here is reset cause:
    C29xx_CPU1: File was loaded successfully. -0-
    C29xx_CPU1: Full load.
    C29xx_CPU1: ResetCauses =  XRSn
    And error aggregator:
    C29xx_CPU1: Error Aggregator Status :
    C29xx_CPU1: Error Aggregator Status Done
  • Hi Boris,

    One more thing sorry, can you send also the output of the ESM_CPU1 to get a list of any possible error that is causing the XRSn?

    Best,

    Ryan Ma

  • Here

    SEC_AP_C29: 
    
    Executing On Target Connect Functions
    
    SEC_AP_C29: 
    
    SEC-AP Ready
    
    C29xx_CPU1: Executing On Target Connect Functions
    C29xx_CPU1: The connected device is F29H850TU9
    C29xx_CPU1: Watchdog Timer Disabled
    C29xx_CPU1: Memory Map Initialization Complete
    C29xx_CPU1: Device Ready
    C29xx_CPU1: M0 RAM initialization complete.
    
    C29xx_CPU1: CPU2/3 is held in reset.
    
    C29xx_CPU1: Program found in Flash memory. Make sure to erase Flash if loading an application to RAM. If loading to Flash, Flash Plugin will erase the selected banks.
    C29xx_CPU1: CPU is in Main code.
    C29xx_CPU1: CPU2/3 is held in reset.
    
    C29xx_CPU1: File was loaded successfully. -0-
    C29xx_CPU1: Full load.
    C29xx_CPU1: ESM_CPU1 Status : 
    C29xx_CPU1:   All Active/Pending Error Events : 
    C29xx_CPU1:   - ESM_EVENT_CPU1_UVFINT
    C29xx_CPU1:   Active/Pending and Enabled Error Events : 
    C29xx_CPU1: ESM_CPU1 Status Done 
    C29xx_CPU1: ESM_CPU1 Status : 
    C29xx_CPU1:   All Active/Pending Error Events : 
    C29xx_CPU1:   Active/Pending and Enabled Error Events : 
    C29xx_CPU1: ESM_CPU1 Status Done 
    C29xx_CPU1: Error Aggregator Status :
    C29xx_CPU1: Error Aggregator Status Done
    C29xx_CPU1: ESM_CPU1 Status : 
    C29xx_CPU1:   All Active/Pending Error Events : 
    C29xx_CPU1:   Active/Pending and Enabled Error Events : 
    C29xx_CPU1: ESM_CPU1 Status Done 
    's the output of ESM_CPU1:

  • Hi Carlos,

    Based on the snippet from ESM_CPU1, there seems to be a UVFINT error.

    This is from the C29x CPU, which corresponds to a floating point under flow event.

    Do you happen to be doing floating point operations that could cause this to occur?

    Best regards,

    Ryan Ma

  • To help clarify the issue further, could you provide more detail on how the IDE handles program loading and execution when a debug session is launched? Specifically, what is the sequence of operations? Does the IDE load the program and then allow it to begin execution before fully halting or resetting the CPU? Understanding that flow would be helpful.

    We are using floating-point operations in the application, though our code doesn’t invoke them until about 500 to 600 ms after the DRV chip is initialized. The global motor0 object does have a constructor, but it should only be initializing values (for example, setting fields to zero). However, it's possible that the C++ initialization order results in some floating-point code being included earlier than expected.

    One hypothesis is that the floating-point initialization logic, which is typically linked in automatically when FP operations are used, may not be correctly set up before execution begins. If the debugger starts execution prematurely or runs portions of the code multiple times during setup, it could interfere with proper FP hardware initialization.

    For context, in past work with Motorola chips, interrupting the FP initialization routine could leave the unit in an undefined state, leading to crashes or unpredictable behavior depending on timing. We’re wondering if something similar might be happening here.

  • Hi Carlos, 

    When you launch a debug session the IDE runs the GEL script defined in the target configuration when first connecting to the device. Then depending on what is configured in the program/memory load options you can select what to occur on a connect etc.

    Best regards,

    Ryan Ma

  • We did not modify any TI-supplied GEL files. We are not proficient in GEL file programming; moreover, I was unable to find good documentation on recent GEL file logic.

    We do see the issue with IDE not starting the correct debug session; hence, we are posting on the forum for help to get the problem resolved.

  • Hi Carlos,

    Apologize for the late response, I was out of the office. 

    We do see the issue with IDE not starting the correct debug session; hence, we are posting on the forum for help to get the problem resolved.

    Is the issue now on the IDE not starting the correct debug session? Are you still running into the UVFINT error or is this resolved?

    Best regards,

    Ryan Ma