


Part Number: C2000WARE-DIGITALPOWER-SDK
Other Parts Discussed in Thread: SFRA
Hello TI Support Team,
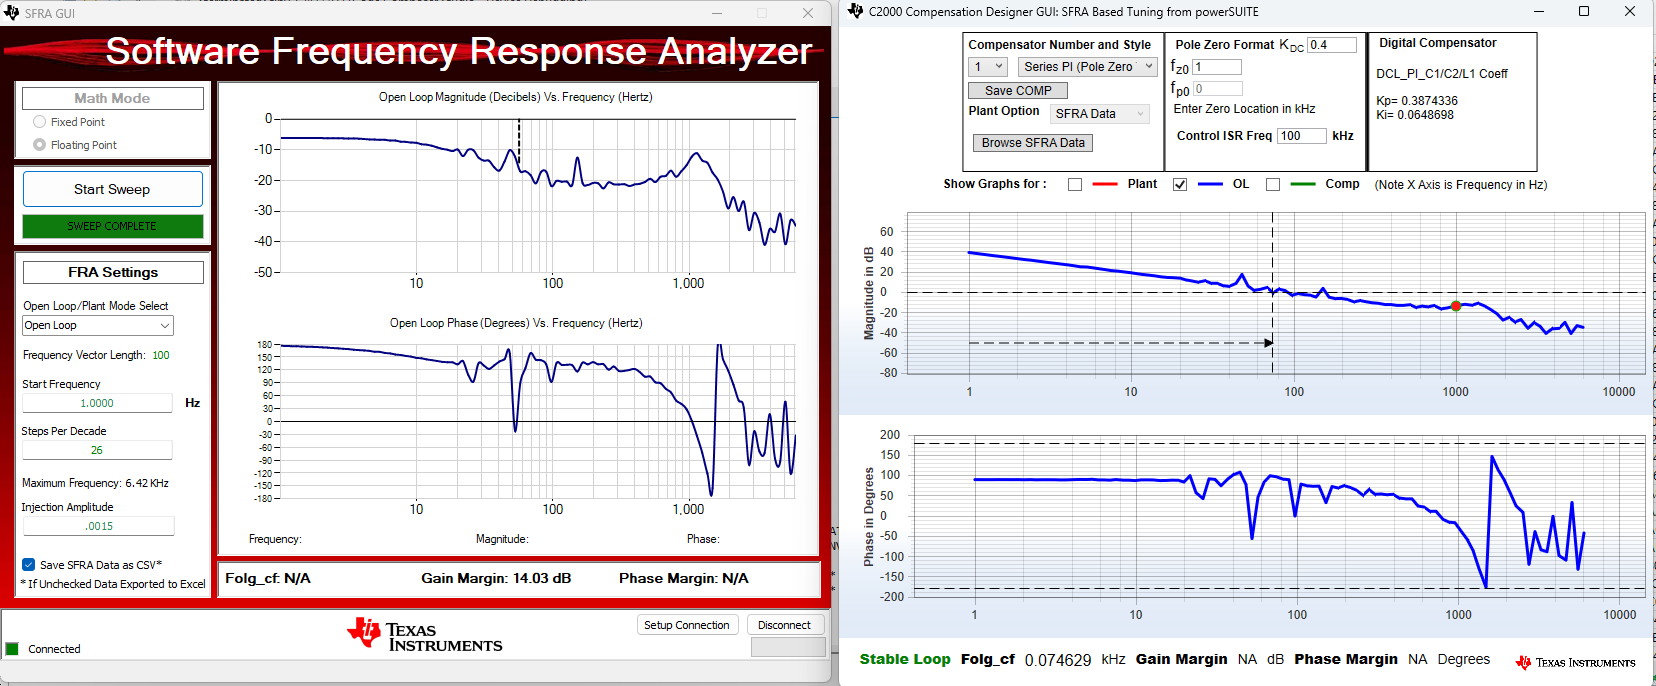
I’m currently using the SFRA (Software Frequency Response Analyzer) library in my C2000-based project. I noticed that when I export the SFRA data (magnitude and phase) and view it in the TI Compensator tool, the plotted response is different from what I observe when viewing the same data within my system or plotting it manually.
Why the data output from SFRA appears different when viewed in the Compensator tool

