AM5728: AM5728 + DSP Automatic Restart Issue

Part Number: AM5728

Hello, I am facing an issue with AM5728 on custom hardware and would like to seek your advice. Here are the details:

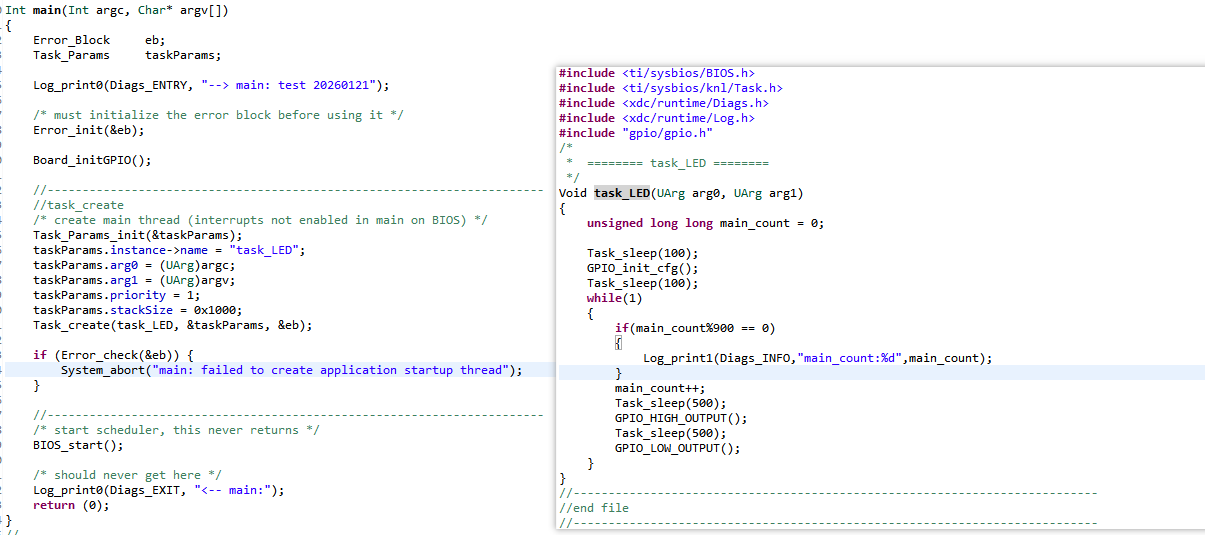
  1. I am testing on custom hardware using Linux remoteproc to run a DSP program. The DSP program's function is solely to control GPIO level toggling.

    image.png
  2. After running for approximately 24+ hours, the DSP automatically restarts and reloads the program.

    root@AM57xx:~# [158273.075388] remoteproc remoteproc2: crash detected in 40800000.dsp: type watchdog
    [158273.083086] remoteproc remoteproc2: handling crash #1 in 40800000.dsp
    [158273.089642] remoteproc remoteproc2: recovering 40800000.dsp
    [158273.100465] remoteproc remoteproc2: failed to unmap 67108864/33554432
    [158273.127483] remoteproc remoteproc2: stopped remote processor 40800000.dsp
    [158273.134390] remoteproc remoteproc2: powering up 40800000.dsp
    [158273.145477] remoteproc remoteproc2: Booting fw image dra7-dsp1-fw.xe66, size 4305652
    [158273.160101] omap-iommu 40d01000.mmu: 40d01000.mmu: version 3.0
    [158273.166074] omap-iommu 40d02000.mmu: 40d02000.mmu: version 3.0
    [158273.189892] virtio_rpmsg_bus virtio0: rpmsg host is online
    [158273.195521] remoteproc remoteproc2: registered virtio0 (type 7)
    [158273.201579] remoteproc remoteproc2: remote processor 40800000.dsp is now up
    [158273.209335] virtio_rpmsg_bus virtio0: creating channel rpmsg-proto addr 0x3d
  3. The Processor SDK version I am using is: ti-processor-sdk-rtos-am57xx-evm-04.03.00.05.

  4. During testing, this issue occurs only on some hardware units, while most units operate normally.

  5. I attempted to modify the dsp1.cfg file by referring to suggestions from related discussions(Linux/AM5728: IPC examples crash on loading in DSP - Processors forum - Processors - TI E2E support forums ),

    but testing showed no improvement.

  6. I initially suspected overheating as the cause, but after adding a cooling fan, the issue persisted without change.

I have run out of troubleshooting ideas. Could you please suggest methods to help me better locate and resolve this problem? If any additional information or logs are required, please let me know. Thank you!


attach files :app.cfg

  • Hello zzh,

    First off, the Linux version and SDK you are using are very out of date and past the support window. I only bring this up so expectations can be adjusted accordingly.

    It seems like you have a watchdog issue perhaps.. See the following thread: https://e2e.ti.com/support/processors-group/processors/f/processors-forum/930321/am5728-using-omap-remoteproc-to-get-dsp-running#:~:text=Watchdog%20timer%20is%20enabled%20though,Prodigy%20130%20points

    The answer to the following questions will help you Isolate whether this is HW vs SW:

    1. Could you please share the traces from the DSP? Did it  crash or is it that the watchdog timed out?

    2. Could you please compare power rail stability for the failing boards vs working boards?

      1. Secondly, do all boards pass DDR testing?

    3. Could you disable the watchdog and see if the issue occurs? (Thread above has a link)

    -Josue

  • Hello,Josue

    Thanks for your support and reply. I will refer to the suggestions provided and proceed with troubleshooting step by step.

    Here is some additional information:

    1. While monitoring the "/sys/kernel/debug/remoteproc/remoteproc2/trace0​"node, no abnormal information was observed before or after the issue
      occurred. The only indication was the DSP system resetting, which caused the counters to reset to zero
    2. Before the last reset occurred, the following error message appeared

      [13734.271800] Unhandled fault: asynchronous external abort (0x211) at 0x00000000
      [13734.271802] pgd = ee1aed40
      [13734.271807] [00000000] *pgd=ad78f003, *pmd=ba852003
      [13739.021915] Unhandled fault: asynchronous external abort (0x211) at 0x00000000
      [13739.021917] pgd = ee278d00
      [13739.021922] [00000000] *pgd=acce0003, *pmd=ba8ca003
      [13813.031753] Unhandled fault: asynchronous external abort (0x211) at 0x00000000
      [13813.031755] pgd = ee1aea80
      [13813.031760] [00000000] *pgd=ae2e8003, *pmd=ba924003
      [19964.354245] remoteproc remoteproc2: crash detected in 40800000.dsp: type watchdog
      [19964.411439] remoteproc remoteproc2: handling crash #1 in 40800000.dsp
      [19964.417908] remoteproc remoteproc2: recovering 40800000.dsp
      [19964.429978] remoteproc remoteproc2: failed to unmap 67108864/33554432
      [19964.457610] remoteproc remoteproc2: stopped remote processor 40800000.dsp
      [19964.464433] remoteproc remoteproc2: powering up 40800000.dsp
      [19964.475414] remoteproc remoteproc2: Booting fw image dra7-dsp1-fw.xe66, size 4305652
      [19964.489927] omap-iommu 40d01000.mmu: 40d01000.mmu: version 3.0
      [19964.495813] omap-iommu 40d02000.mmu: 40d02000.mmu: version 3.0
      [19964.519348] virtio_rpmsg_bus virtio0: rpmsg host is online
      [19964.520635] virtio_rpmsg_bus virtio0: creating channel rpmsg-proto addr 0x3d
      [19964.531960] remoteproc remoteproc2: registered virtio0 (type 7)
      [19964.537905] remoteproc remoteproc2: remote processor 40800000.dsp is now up


    I will continue to investigate based on your guidance. If you need any other specific logs or details, please let me know.

    Best regards,
    zzh

  •  ,

    The asynchronous abort is most likely related to the DSP not being on or no clock is found which makes sense if the watchdog is resetting the DSP.

    Let me know if you are able to disable the watchdog to test.

    -Josue

  • Yes, I have retested after disabling the watchdog in the device tree.
    Current observation:​
    The DSP no longer restarts, but the program itself also fails to run.
    Does this imply that the crash was actually triggered by an exception/fault within my DSP program, which caused the DSP core itself to crash?
    Below is the trace information.

    root@AM57xx-Tronlong:~# cat /sys/kernel/debug/remoteproc/remoteproc2/trace0
    [      0.000] Watchdog disabled: TimerBase = 0x48086000 ClkCtrl = 0x4a009728
    [      0.000] 24 Resource entries at 0x95000000
    [      0.000] [t=0x0002bdeb] xdc.runtime.Main: --> main: test 20260121
    [      0.000] registering rpmsg-proto:rpmsg-proto service on 61 with HOST
    [      0.000] [t=0x00053055] xdc.runtime.Main: NameMap_sendMessage: HOST 53, port=61
    [      0.000] Watchdog disabled: TimerBase = 0x48086000 ClkCtrl = 0x4a009728
    [      0.200] [t=0x089be3e3] xdc.runtime.Main: main_count:0
    [    643.555] A0=0x9531e720 A1=0x0
    [    643.555] A2=0x1 A3=0x95320fa0
    [    643.555] A4=0x0 A5=0x8000
    [    643.555] A6=0x0 A7=0x0
    [    643.555] A8=0x952811c8 A9=0x9530414c
    [    643.555] A10=0x0 A11=0x95286fcc
    [    643.555] A12=0x0 A13=0x0
    [    643.555] A14=0x0 A15=0x0
    [    643.555] A16=0x6c A17=0xffffffff
    [    643.555] A18=0x952888d0 A19=0x30
    [    643.555] A20=0x16e A21=0x952888d0
    [    643.555] A22=0x9f000000 A23=0x952888d0
    [    643.555] A24=0x952888d0 A25=0xe96c6f38
    [    643.555] A26=0x57bd2412 A27=0xb67b0173
    [    643.555] A28=0xd9e08f61 A29=0x81a8b90e
    [    643.555] A30=0x100 A31=0x952612b4
    [    643.555] B0=0x0 B1=0x48086000
    [    643.555] B2=0x95321880 B3=0x95320fac
    [    643.555] B4=0x1 B5=0x0
    [    643.555] B6=0x95288968 B7=0x95288ad0
    [    643.555] B8=0x0 B9=0x952787c4
    [    643.555] B10=0x95286fc8 B11=0x9532188c
    [    643.555] B12=0x0 B13=0x0
    [    643.555] B14=0x95288c08 B15=0x952787d8
    [    643.555] B16=0xa B17=0x952888d0
    [    643.555] B18=0x1 B19=0xfffffff8
    [    643.555] B20=0x4c B21=0x69
    [    643.555] B22=0x2a B23=0x2e
    [    643.555] B24=0x10d0eb6d B25=0x2728a4
    [    643.555] B26=0x60b080db B27=0xbb91640
    [    643.555] B28=0x3ce8a065 B29=0x0
    [    643.555] B30=0x952612d8 B31=0x952612d8
    [    643.555] NTSR=0x1000f
    [    643.555] ITSR=0xf
    [    643.555] IRP=0x9531e6f8
    [    643.555] SSR=0x0
    [    643.555] AMR=0x0
    [    643.555] RILC=0x0
    [    643.555] ILC=0x0
    [    643.555] Exception at 0x9531de8c
    [    643.555] EFR=0x2 NRP=0x9531de8c
    [    643.555] Terminating execution...
    

    zzh

  •  ,

    This is what the logs show. Does this happen immediately? Or after some time?

    It would be worth while to investigate what is causing this internal exception at  0x9531de8c?

    You can inspect using ROV or by inspecting the code/map file.

    -Josue

  • Thank you for your reply.
    The issue has a random reproduction time, which could be several hours or even dozens of hours.
    I will follow your suggestions and focus my investigation in this direction.
  • Interesting. Keep an eye out for memory issues.. like a stack overflow or uninitialized variables.

    -Josue