TMS320F28P650DH: Debugger stops suddenly

Part Number: TMS320F28P650DH
Other Parts Discussed in Thread: TMS320F28379D

Hello, 

I have made my first design with the TMS320F28P650DH and I have a problem with the XDS110 debugger. Sometimes the debugger stops an shows the following error message.


image.png

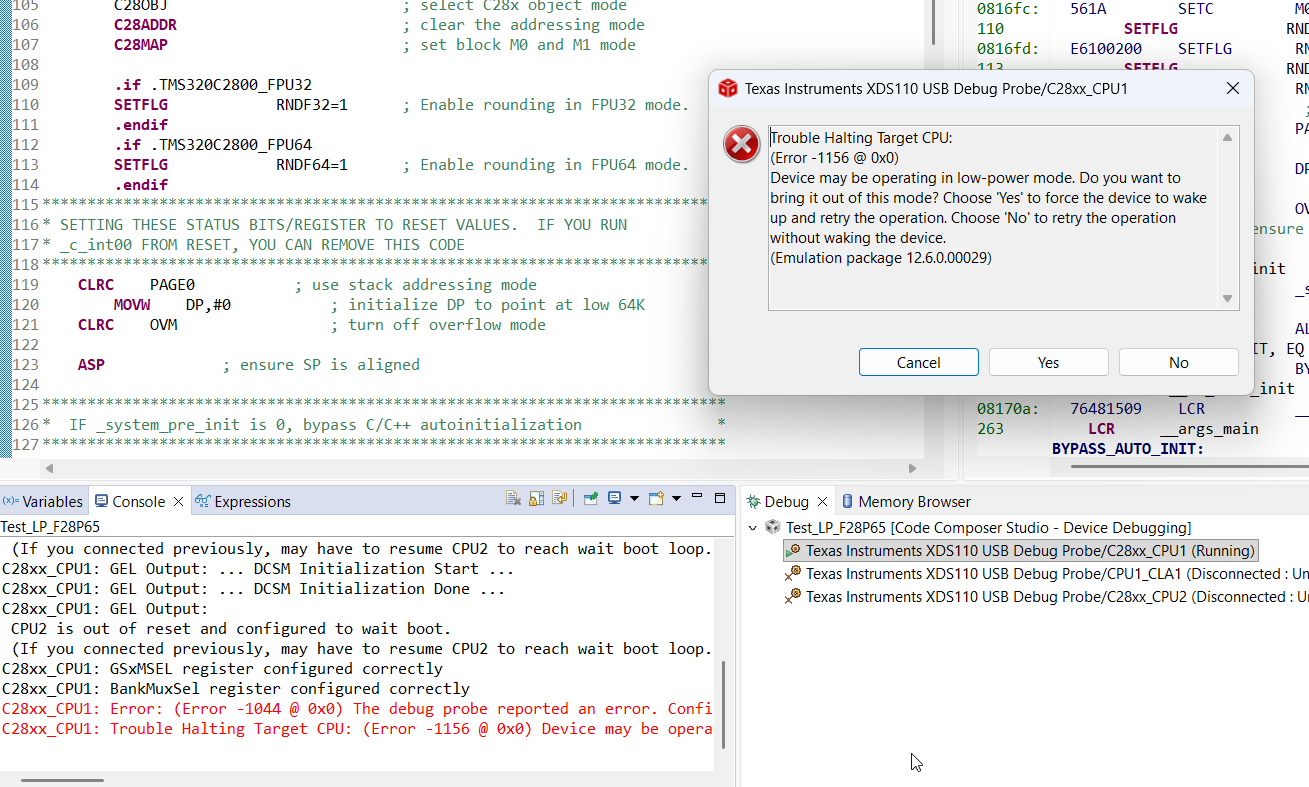
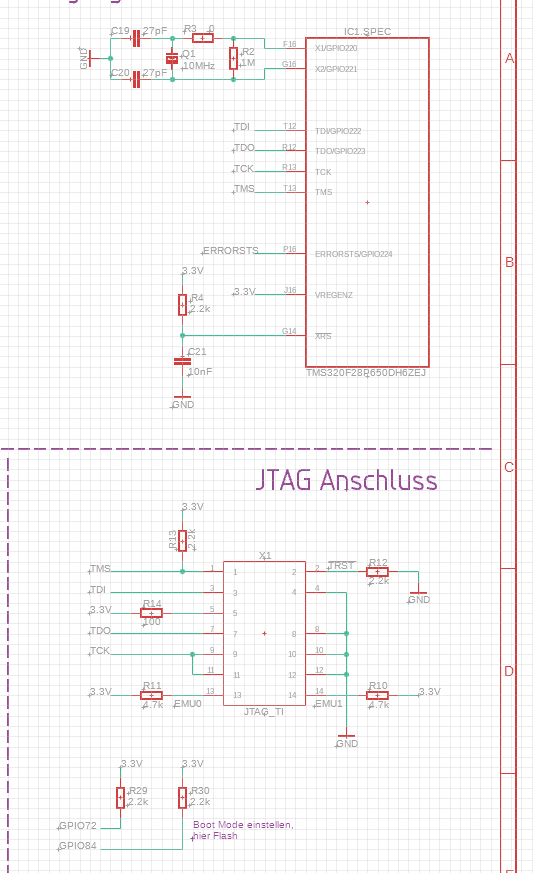
After that the DSP must be powered off an on to work again. I have connected the XDS110 as follows.

image.png


What is the reason for the debugger crash?


Thank you very much.


Ralf


  • Hi,

    Does it happen during runtime or flash programming? What is the status of XRSn? 

    Please try power cycling the debug probe without power cycling the MCU and use more reliable JTAG settings like lower TCK frequency. 

    Best,
    Matt

  • Hello Matt,
    the problem occurs during runtime, not during the flash of the device.

    The !XRS pin is connected to 3.3 V via a 2.2kΩ resistor and to ground via a 10nF capacitor.

    After the debugger crashes, the CPU continues normal operation. There is no reset of the cpu. I can read out via SCI a variable that counts the seconds after the last reset. This variable continues normal. If there were a cpu reset, this variable would start counting from zero.

    After a power cycling of the debugger (usb plus removed and reconnected) the debugger doesn´t start again. I have to make a power cycling of the cpu if I want to start the debugger again.

    I have reduced the JTAG clock frequency from 5.5MHz to 2MHz. This doesn´t help, after approximately ten minutes the debugger crashed again.

    In order to check the physical voltage levels and the shapes of the JTAG I have measured TMS, TDI, TDO and TCK with a scope

    C1: TMS
    C2: TDI
    C3: TDO
    C4: TCK

    Plot1 shows the operation with 5.5MHz , plot2 with 2MHz TCK frequency. Those plots seems to be ok.

    Are there other things I can check?

    Best regards

    Ralf


  • Hello,

    Apologies, I am out of office until next Wednesday. Please expect a delay in response until then.

    Best,

    Matt

  • Dear Matt,
    I have checked my new pcb at my private notebook at home. On this machine it workes without any problem. For this reason the problem must be something with the USB connection on my company notebook.

    Do you have a test tool or anything else to check this connection?

    Best regards

    Ralf

  • Hello,

    Apologies, I am out of office until Wednesday. Please expect a delay in response until then.

    Best,

    Matt

  • Hello

    That is good to know that the device isn't reset during this event.

    We don't offer any USB test tools to check that connection, besides the "Test Connection" in the target configuration *.ccxml. You could try performing a firmware upgrade for the XDS110 drivers, README provided in CCS at: "ccs\ccs_base\common\uscif\xds110\XDS110SupportReadMe.pdf"

    Are you plugging in the JTAG probe into a docking station? Does the issue occur when using any of the other USB ports on the faulty PC? 

    Best,
    Matt

  • Hello,
    to rule out the docking station and the USB hub as potential sources of error, I connected the XDS110 directly to the notebook. After about 10 minutes, the debugger disconnected again (see screenshot).

    What is the meaning of the error code 1156?

    In the previous project I have used a TMS320F28379D. I have tested the debugger and the complete toolchain with this controller and I have no debugger crash.

    Are there any differences in the JTAG port of these controllers?


    Thank you very much

    Ralf

  • Hi Ralf,

    There should be no drastic differences between the debug subsystems of these devices. 

    What is the meaning of the error code 1156?

    A description of the error code can be found here: https://software-dl.ti.com/ccs/esd/documents/ccs_debugging_jtag_connectivity_issues.html#low-power-run-mode

    After about 10 minutes, the debugger disconnected again (see screenshot).

    Are you able to scope the JTAG signals when it crashes? And is VDDIO/VDD stable when this happens? If everything looks okay, then something in your application flow is disconnecting the JTAG probe at that time. Are the mux options for the GPIOs used by TDI/TDO maintained for JTAG usage?

    Best,
    Matt

  • Dear Matt,
    thanks for your response. I haven´t used the mux GPIO option on the jtag pins.

    I have checked the levels of the 3.3V and 1.2V of the cpu at the time when the debugger crashes. For this I have used a dropout trigger of 400ms at the TMS line. The voltages are OK.

    What´s about the TRST pin at the debugger. On my pcb I have used a 2.2kohm pull down resistor. In contrast to the F28379D the F28P65 does not have a TRST pin. When the debugger is connected I have measured a strange level of 2.6V. Since TRST is a digital pin I expect a level of 0V or 3.3V.

    Could this be a problem?


    Thank you

    Ralf

  • Hi Ralf,

    This could be a potential issue. Generally, we recommend leaving it as NC for our new generation devices that don't require TRSTn. Otherwise, your schematic matches the datasheet recommendations (besides having pull-ups on TDI/TDO). It may also be worth debugging with 2-pin cJTAG to rule out TDI/TDO issues.

    Best,
    Matt

  • Dear Matt,

    in the last days I have made many long term runs with the test pcb. The problem occurs only when the pcb is connected to may business notebook in the company itself. If I use the business notebook in the home office it works over several hours without any problem. Therefore the problem should be caused from the IT infrastructure of our company. For this reason we can close the ticket.


    Best regards


    Ralf