This thread has been locked.

If you have a related question, please click the "Ask a related question" button in the top right corner. The newly created question will be automatically linked to this question.

Concerto F28M35H52C1 assembler instructions execution time

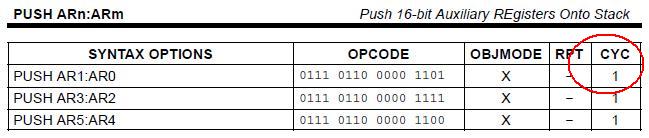
         There is a problem connected with an asembler instructions execution time in my program. As described in the "TMS320C28x CPU and Instruction Set Reference Guide" (SPRU430E), such commands as "PUSH ARn:ARm" and "MOV AX,loc16" (for example) should be execute for 1 cycle:


     But in practise i have  different time of execution:

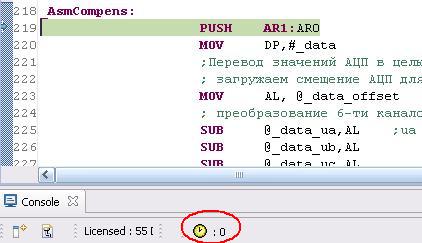
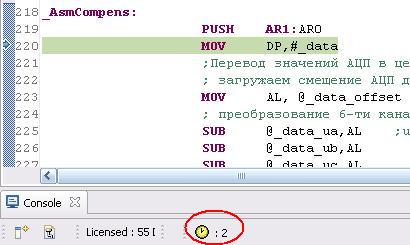
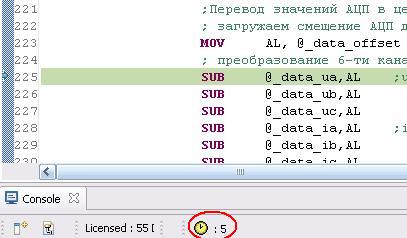
       Such time differences appears not only in this commands. What is the reason for this differences?

  • Hi George!

    Values on your screenshot have a random error (+-1). In this case, I'd rather trust the documentation than the debugger.

    Regards,

    Igor

  •    Thanks for the answer!

    I trust the documentation, I know that single-cycle instructions really does take one clock cycle etc. But now I am creating real-time program and it is very important for me to know how many real clock cycles it will run. 

    You advise me to count the number of cycles on the documentation and do not pay attention to the incorrect clock-counter value?

    By the way, do you know the cause of such error? Is the problem actual for all debbugers?

                             regards, George

  • Hi George!

    George Belyakov said:

    But now I am creating real-time program and it is very important for me to know how many real clock cycles it will run.

    You advise me to count the number of cycles on the documentation and do not pay attention to the incorrect clock-counter value?

    By the way, do you know the cause of such error? Is the problem actual for all debbugers?

    I would not want to incur a lot of criticism and I do not claim to absolute truth. From my point of view, the work under the debugger is certainly necessary. But anyway, we must remember that this is nevertheless a emulation of the real device work. Especially when it comes to real-time systems. Therefore, the question of interpretation of the results obtained in debug mode is a matter of the developer directly, given that the developer uses the actual documentation of a specific device. It would be certainly interesting to know the opinion of TI employees about your issue...

    Regards,

    Igor

  • Hi George!

    BTW one question. Do you use Single Subsystem Debug (28x core only) or Dual Subsystem Debug (28x & M3 cores are connected simultaneously)? If second case then perhaps this is reason...

    Regards,

    Igor

  •       Hi, Igor! 


    I use dual-mode in my project,  therefore it's really may be the reason of error, thank you. Yes, it's interesting, what TI employees will say about this problem.

    Thank you, for your viewpoint. Probably, i have to count the cycles with a timer.

    regard, George

  • These 'skid' cycles are discussed a bit in the C28x CPU users guide section 7.3. The benchmark counter is best used on chunks of code. where off by one cycle doesn't really matter, instead of small snippits. 


    7.3 Benchmark Counter/Event Counter(s)
    The 40-bit performance counter on the C28x can be used as a benchmark
    counter to increment every CPU clock cycle (it can be configured not to count
    when the CPU is in the debug-halt state). Wait states affect the counter. Wait
    states in the read 1 and write pipeline phases of an executing instruction affect
    the counter, regardless of whether an instruction is being single-stepped or
    run. However, wait states in the fetch 1 pipeline phase do not affect the counter
    during single-stepping, because the cycle counting does not begin until the de-
    code 2 pipeline phase. The counter counts wait states caused by instructions
    that are fetched but not executed. In most cases, these effects cancel each
    other out. Benchmarking is best used for larger portions of code. Do not rely
    heavily on the precision of the benchmarking. (For more information about the
    pipeline, see Chapter 4.)

  • One other point - the cycles in the users guide assume the best case possible: code is in single cycle RAM and the opcodes being fetch are in a different physical memory from data being read/written by an instruction.   The memory map in the data manual shows the physical blocks of memory.

  • Hi Lori!

    I was suspecting that here all is not as simple... 

    Many thanks to you for explanation and thanks to David for attention to my request.

    Regards,

    Igor

  •     Hi, Lori!

    Thank you very much for so detailed answer, you helped me a lot in my project!

    Regards, George