This thread has been locked.

If you have a related question, please click the "Ask a related question" button in the top right corner. The newly created question will be automatically linked to this question.

Using breakpoint results in wrong behavior

Other Parts Discussed in Thread: TMS320C28346, TMS320F28027, TMS320F28335

Hello fellow coders,

Today I was debugging my code on TMS320C28346 mcu and found strange behavior while inserting (hardware breakpoints) to my code. It seems that the cpu does not execute the instruction if it stops to a breakpoint at the same location.

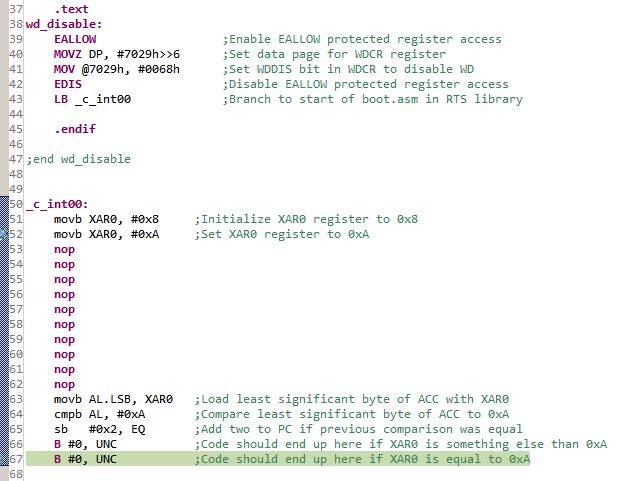
I have attached minimum working example from the problem. It is basically the standard CodeStartBranch.asm with few lines of additional code. The added few lines are:

c_int00:
00a008:   D008        MOVB         XAR0, #0x8
00a009:   D00A        MOVB         XAR0, #0xa
00a00a:   7700        NOP 

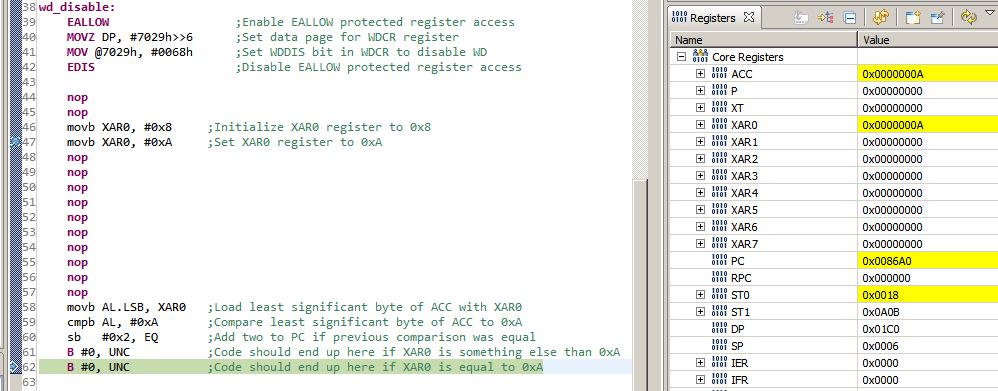
As the cpu executes the code, I would expect that there is 0x0000000A stored to the XAR0 register. However, if you do the following:

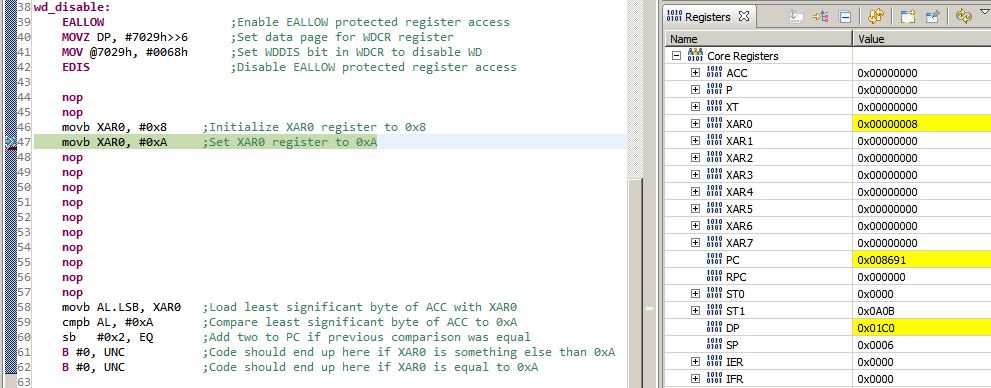
1. Put a breakpoint (software or hardware) to address 0x00A009
2. Let the debugger stop the cpu in address 0x00A009
3. Step the 'MOVB XAR0, #0xA' instruction
4. XAR0 register will show value 0x00000008

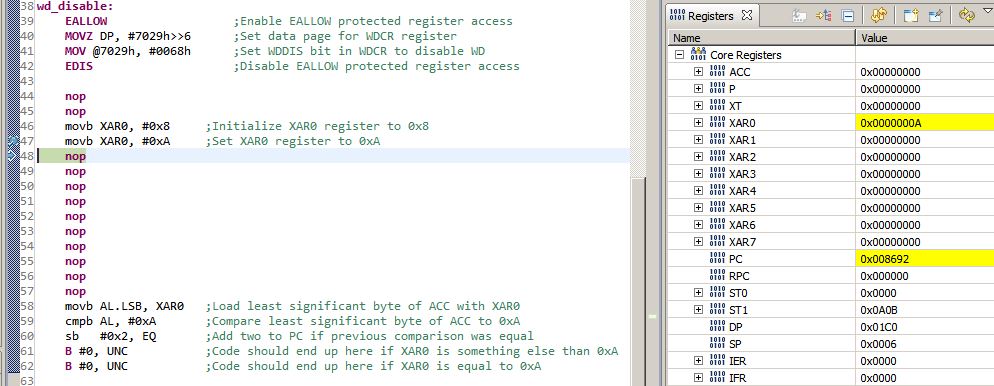
If I put breakpoint only to address 0x00A00A and run the code, the XAR0 register will show 0x0000000A.

Is my debugger configuration screwed up? This basically renders debugger unusable if it alters the behavior I am trying to observe.

My debugger is XDS100v2 and version of my compiler tools is TI v6.1.0.

5415.DSP2833x_CodeStartBranch.asm

  • Chester,

    I just tested on F28069 (I do not have a C2834x board on me right now), and I do not see a problem.

    The code is running from flash memory.  You can see the breakpoint set.  I ran to the breakpoint, and XAR0=0x8.  I then did a step, and XAR0=0xA, as expected.

    F28069 vs. C28346 should not make a difference.  I wonder why you tried hardware breakpoints on C28346 anyway though, as the device is all RAM (no flash).  But regardless, the HW breakpoint should work.  Try putting some (maybe 10) NOPs after the MOVB XAR0 0xA, and then step multiple times.  Does the XAR0 value ever change to 0xA?  This is to test to see if the pipeline is flushing on single-step.  It should.

    Regards,

    David

  • Hello David!

    I'm sorry for inconvenience. It would be interesting to know your opinion about another case of strange behaviour under debug mode http://e2e.ti.com/support/microcontrollers/c2000/f/171/p/297363/1037452.aspx#

    Thanks,

    Igor

  • Hi David,

    Thank you for your quick response.

    I added the 10 nops after MOVB instruction and executed the code but the XAR0 register did not change to 0xA. I executed the code by single instruction stepping and also executing it 'normally'. I have also added few instructions to ensure that the XAR0 is indeed 0x8 (this should eliminate wrong readings in CCS registers window):

    _c_int00:
    00a008: D008 MOVB XAR0, #0x8 ;Initialize XAR0 register to 0x8 00a009: D00A MOVB XAR0, #0xa ;Set XAR0 register to 0xA 00a00a: 7700 NOP 00a00b: 7700 NOP 00a00c: 7700 NOP 00a00d: 7700 NOP 00a00e: 7700 NOP 00a00f: 7700 NOP 00a010: 7700 NOP 00a011: 7700 NOP 00a012: 7700 NOP 00a013: 7700 NOP 00a014: C6A0 MOVB AL.LSB, @AR0 ;Load least significant byte of ACC with XAR0 00a015: 520A CMPB AL, #0xa ;Compare least significant byte of ACC to 0xA 00a016: 6102 SB 2, EQ ;Add two to PC if previous comparison was equal 00a017: 6F00 SB 0, UNC ;Code should end up here if XAR0 is something else than 0xA 00a018: 6F00 SB 0, UNC ;Code should end up here if XAR0 is equal to 0xA

    Exeution of code ends up in 0x00A017 if breakpoint (software or hardware) is placed to 0x00a009. If the breakpoint is missing, execution ends up in 0x00A018.

    I use hardware breakpoints with my main project because the application is loaded from FLASH to RAM by a custom bootloader. CCS/debugger does not know when the real application starts and thus the software breakpoints are not updated. Hardware breakpoints are not erased during this load procedure.

    I have attached the updated code.

    7268.DSP2833x_CodeStartBranch.asm

    Best regards,

    Henrik

  • Henrik,

    I am traveling this week so I cannot test on C28346.  I will check next week.  But, I think it is safe to say that C2834x has been around for many years, and if there was a breakpoint problem we would have found it a long time ago.  I know I have debugged code using breakpoints on C2834x in the past, and not seen any issues.  So, I very much doubt this is a hardware problem.

    CCS also shouldn't cause this problem.  I know for the simulator targets, you can configure CCS to flush or not flush the pipeline on a step.  But, this is for the simulator only, and anyway flushing/not flushing the pipeline does not affect the eventual execution of the instruction at hand.  That is why I had you add the NOPs.  Even if the pipeline was not flushed on a break, you'd eventually execute the instructions in question if you stepped 6-8 times (C28x pipeline is 8 stages).

    As I said, I'll take a look at the issue on C28346 next week when I am back in my office.

    Regards,

    - David

  • Henrik,

    I tested the C28346 this morning, and as I expected the breakpoints are working correctly.  I inserted your exact ASM code into my CodeStartBranch.asm file.  Here is the screen shot after hitting the breakpoint at line 47.  You can see that XAR0=0x8 in the register view:

    If you then single-step, XAR0 changes to 0xA, which is expected:

    If instead of stepping from the breakpoint, I do a RUN and then HALT, I end up at line 62.  Again, this is expected and correct:

    I am using XDS100v2 emulator same as you, and CCSv5.5.  There is no configuration option in CCS to supress execution of the instruction at a breakpoint (and such an option would make no sense since why would anyone want to do this?).  I've also tested with both HW ans SW breakpoint.  Execution is correct with either type.  There must be something else going on in your system, but what I do not know.

    Regards,

    David


  • Hi David,

    I was able to repeat this problem with TI dev kits (TMS320F28027, TMS320F28335 and TMS320C28346). Updating CCS to newest version 5.5.0.00077 made no difference. I updated also CCS plugins and made sure that the XDS100v2 drivers were up to date. Also my colleague was able to repeat this problem on his machine.

    I was able get through with correct behavior few times and think there is some kind state involved. These are my findings:

    1. Getting correct behavior is related to free run (green triangle) of the debugger after program load. Once one has loaded program (start debugging session, connect to the target, load program) placing a breakpoint (software or hardware) in to 'movb XAR0, #0xA' and pressing free run will stop to 0xA008 in my case. Single stepping after this XAR0 will be loaded with 0xA. Behavior is correct after restarting execution using single-stepping and there is no need for free run.

    2. Wrong behavior is achieved by not using free run. Loading program (start debugging session, connect to the target, load program), placing breakpoint and single-stepping results in wrong behavior. Restarting execution and single-stepping afterwards results in wrong behavior. However, if one restarts execution and uses free run, the behavior is correct then on.

    Could you please test this single-stepping method? From your post I am not sure have you used free run for the first step or not.

    I have no clues why my original code executed with wrong behavior even though I had used free fun.

    Best regards,
    Henrik

  • Henrik,

    I'm not doing anything with FREE RUN.  I believe what FREE RUN does is disable all breakpoints and then disconnects from the target. This let's the target run.  When you hit HALT, CCS reconnects, halts the processor, and re-enables the breakpoints.

    I just tested again using CCSv5.5, F28335 and XDS100v2 (same as you).  Built the code, flashed the code, reset the processor (CCS reset), and set the breakpoint on 'movb XAR0, #0xA'.  Hit RUN, and I hit the breakpoint.  Hit RUN again, followed by HALT, and I see XAR0=0xA in the register view and the code is at the 'B #0, UNC           ;Code should end up here if XAR0 is equal to 0xA' instruction:

    The above '_c_int00' function is YOUR CODE.  I copied it from your forum post file attachment.  Note that in the above test I used a HW breakpoint because the project is running from flash.  But, I could do the same thing with a SW breakpoint in RAM and have the same results.

    I do not know what is going on with your setup.  It is even stranger that you say you see the same thing on a co-workers setup.  Believe me, CCS has been around a long time and so has the C2000.  When you set a breakpoint, it does not interfere with the execution of the instruction at the breakpoint.  It's been working correctly for a long time.  I have no doubt that something funny is going on with your setup.  I just cannot tell you what via remote support such as this forum.

    You can try another emulator if you have one.  Maybe something is wrong with your emulator (although personally, I doubt it).

    - David