


Other Parts Discussed in Thread: TMDSHVMTRINSPIN
I've been running lab4a successfully using CCS v5.5. I'm trying to plot various variables, such as Speed_Krpm. I've checked the forums, and I found out to download HVMotorCtrl+PFC (R1.1) Kit How to Run Guide from Control_Suite. However, I'm using TMDSHVMTRINSPIN, and will also be using this soultion in my other kits, DRV8312-69M-kit, and DRV8301-69M-kit. I followed directions as the manual said, but the values are not shown in the format that I can make sense at when i view the plots. In the graph properties, Acquisition Buffer Size is 200, DSP Data Type is 16 bit signed integer, Q_Value is 15. Display Data Size is 200. Now my question is this , Speed_Krpm is defined as Q24. But when i plot the variable, i don't want see 20000000 on the axis, i would like to see 1.25 kRPM on the plot. and this applies to any variable I want to plot (that's defined in Q format). Shown in the figures is how I set up the plotting of speed_rpm (I've tried many other values):
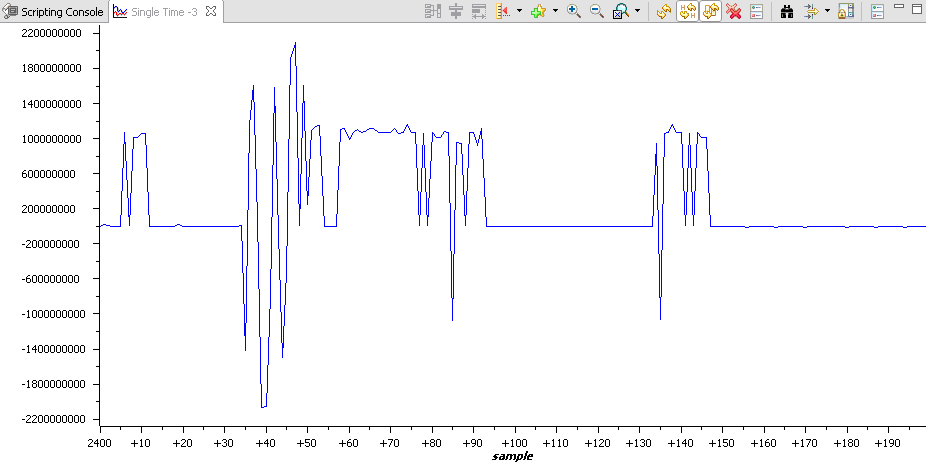
I'm trying to graph the spped as shown in the expressions below,
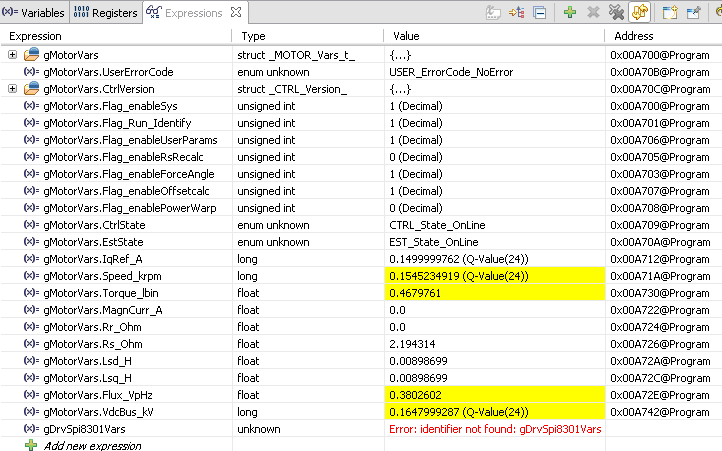
Now I know that this is incorrect.
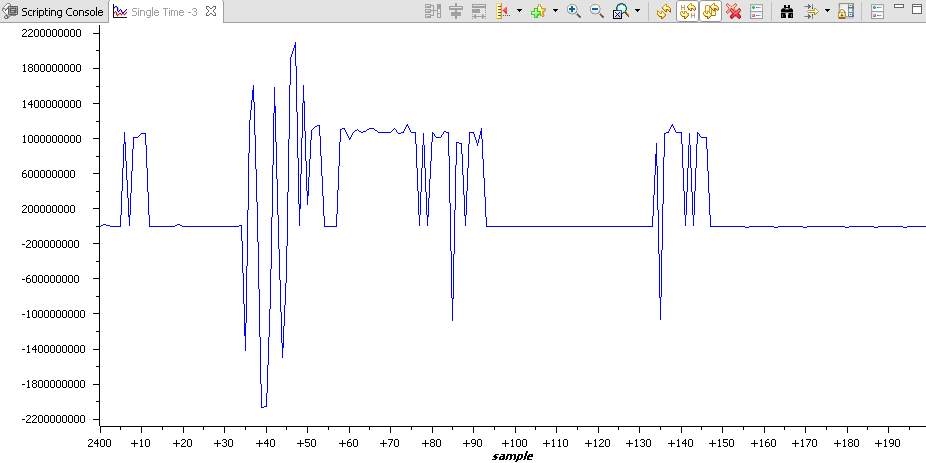
so, when the variable is defined as signed int 32, and Q24, I would like to see the nuber on the plot in a
a format i can understand.
Please help me make sense of how to use the graphic capability.
Please help Chris, I've had this question on the forum for 5 days now.