


i'm following the step by controlSUITE Sensored FOC of ACI.
I got a strange graph when testing the Clarke module(Phase 2A).
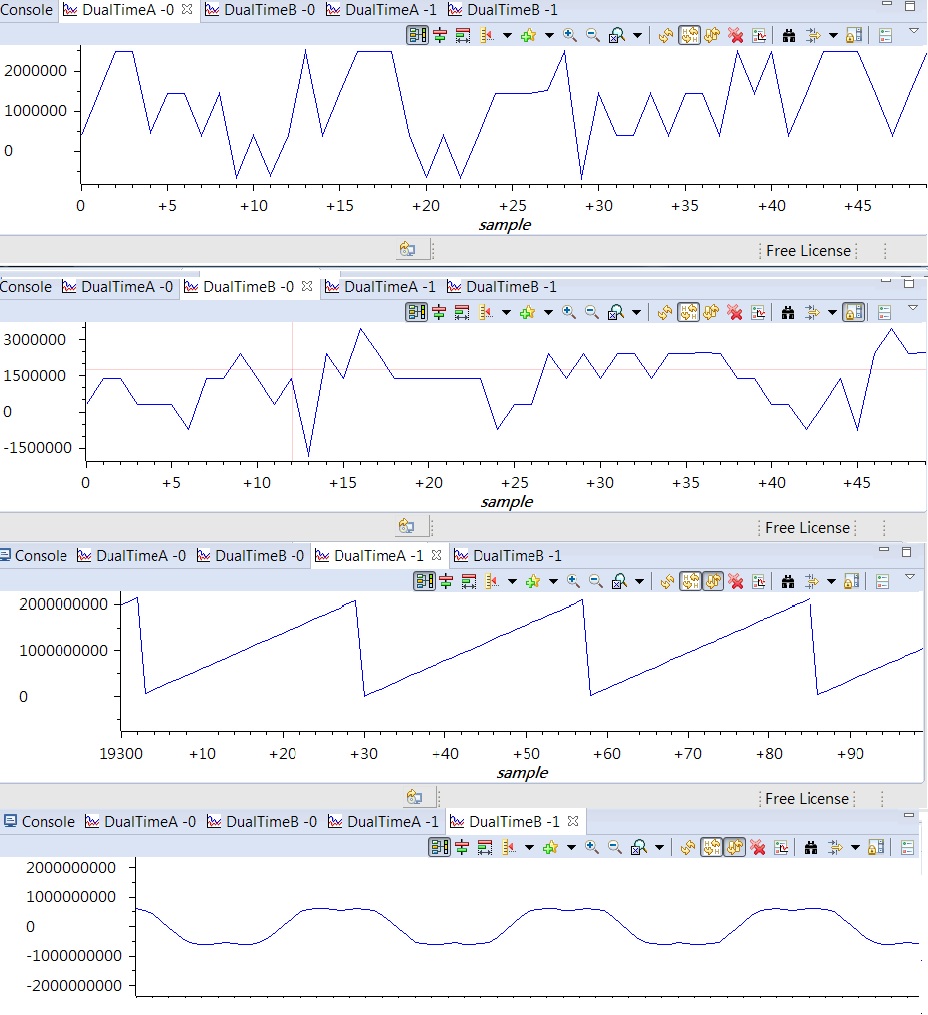
The graphs from up to down are clarke.As(Phase A), clarke.Bs(Phase B), rg1.Out, svgen1.Ta.
third and fourth figure look right, but first and second are strange.
