Other Parts Discussed in Thread: TMS320F28065
Hi Support,
my customer is performing benchmark tests on FastRTS library (in particular function sincos()) on TMS320F28065 device.
The selection of CGT leads to significative compiling time and execution difference!
Tested CGTs: 6.4.10 and 15.12.3.LTS
Same settings: optimization OFF, as in following screenshots:
CGT 6.4.10

CGT 15.12.3.LTS

The execution timing is measured using GPIO set and clear on the following code (within the same source code):
MARK2_SET;
sincos(angle_test, &sin_theta, &cos_theta);
MARK2_CLR;
where:
#define MARK2_SET {\
GpioDataRegs.GPASET.bit.MK2GPIO = 1u;\
}
#define MARK2_CLR {\
GpioDataRegs.GPACLEAR.bit.MK2GPIO = 1u;\
}
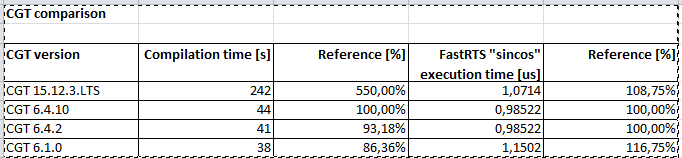
Results
CGT 6.4.10
Compilation time: 44 seconds
Execution time ("sincos" with FastRTS): 0.98522 us
CGT 15.12.3.LTS
Compilation time: 4 minutes and 2 seconds
Execution time ("sincos" with FastRTS): 1.0714 us
This is a 8.75% increase in computational time and a huge increase in compilation time!
Moreover, from the fastRTS Libary user's guide (chapter 7 - Benchmarks):

The TMS320F28065 has zero-wait states Boot ROM (datasheet, sprs698f.pdf, Figure 6-5, pag 52) so I consider 44 cycles.
At 90 MHz the "ideal" execution time would be:
ExecTime = 44 / 90000000 = 0.49 us
Even if considering 50 cycles I get 0.55 us
In the best case (CGT 6.4.10), knowing that there is an overhead for managing input data + results and GPIO toggle, I get almost twice the expected timing.
Even worse using CGT 15.12.3.LTS, not to speak about the compiling time that lasts ages (compared to the other CGT).
What do I have to do / set in my project?
Many thanks in advance for helping me supporting customer with this issue.
Alberto