


The part in the red circle is sine changed variable, but in the graph, it is not sine curve.
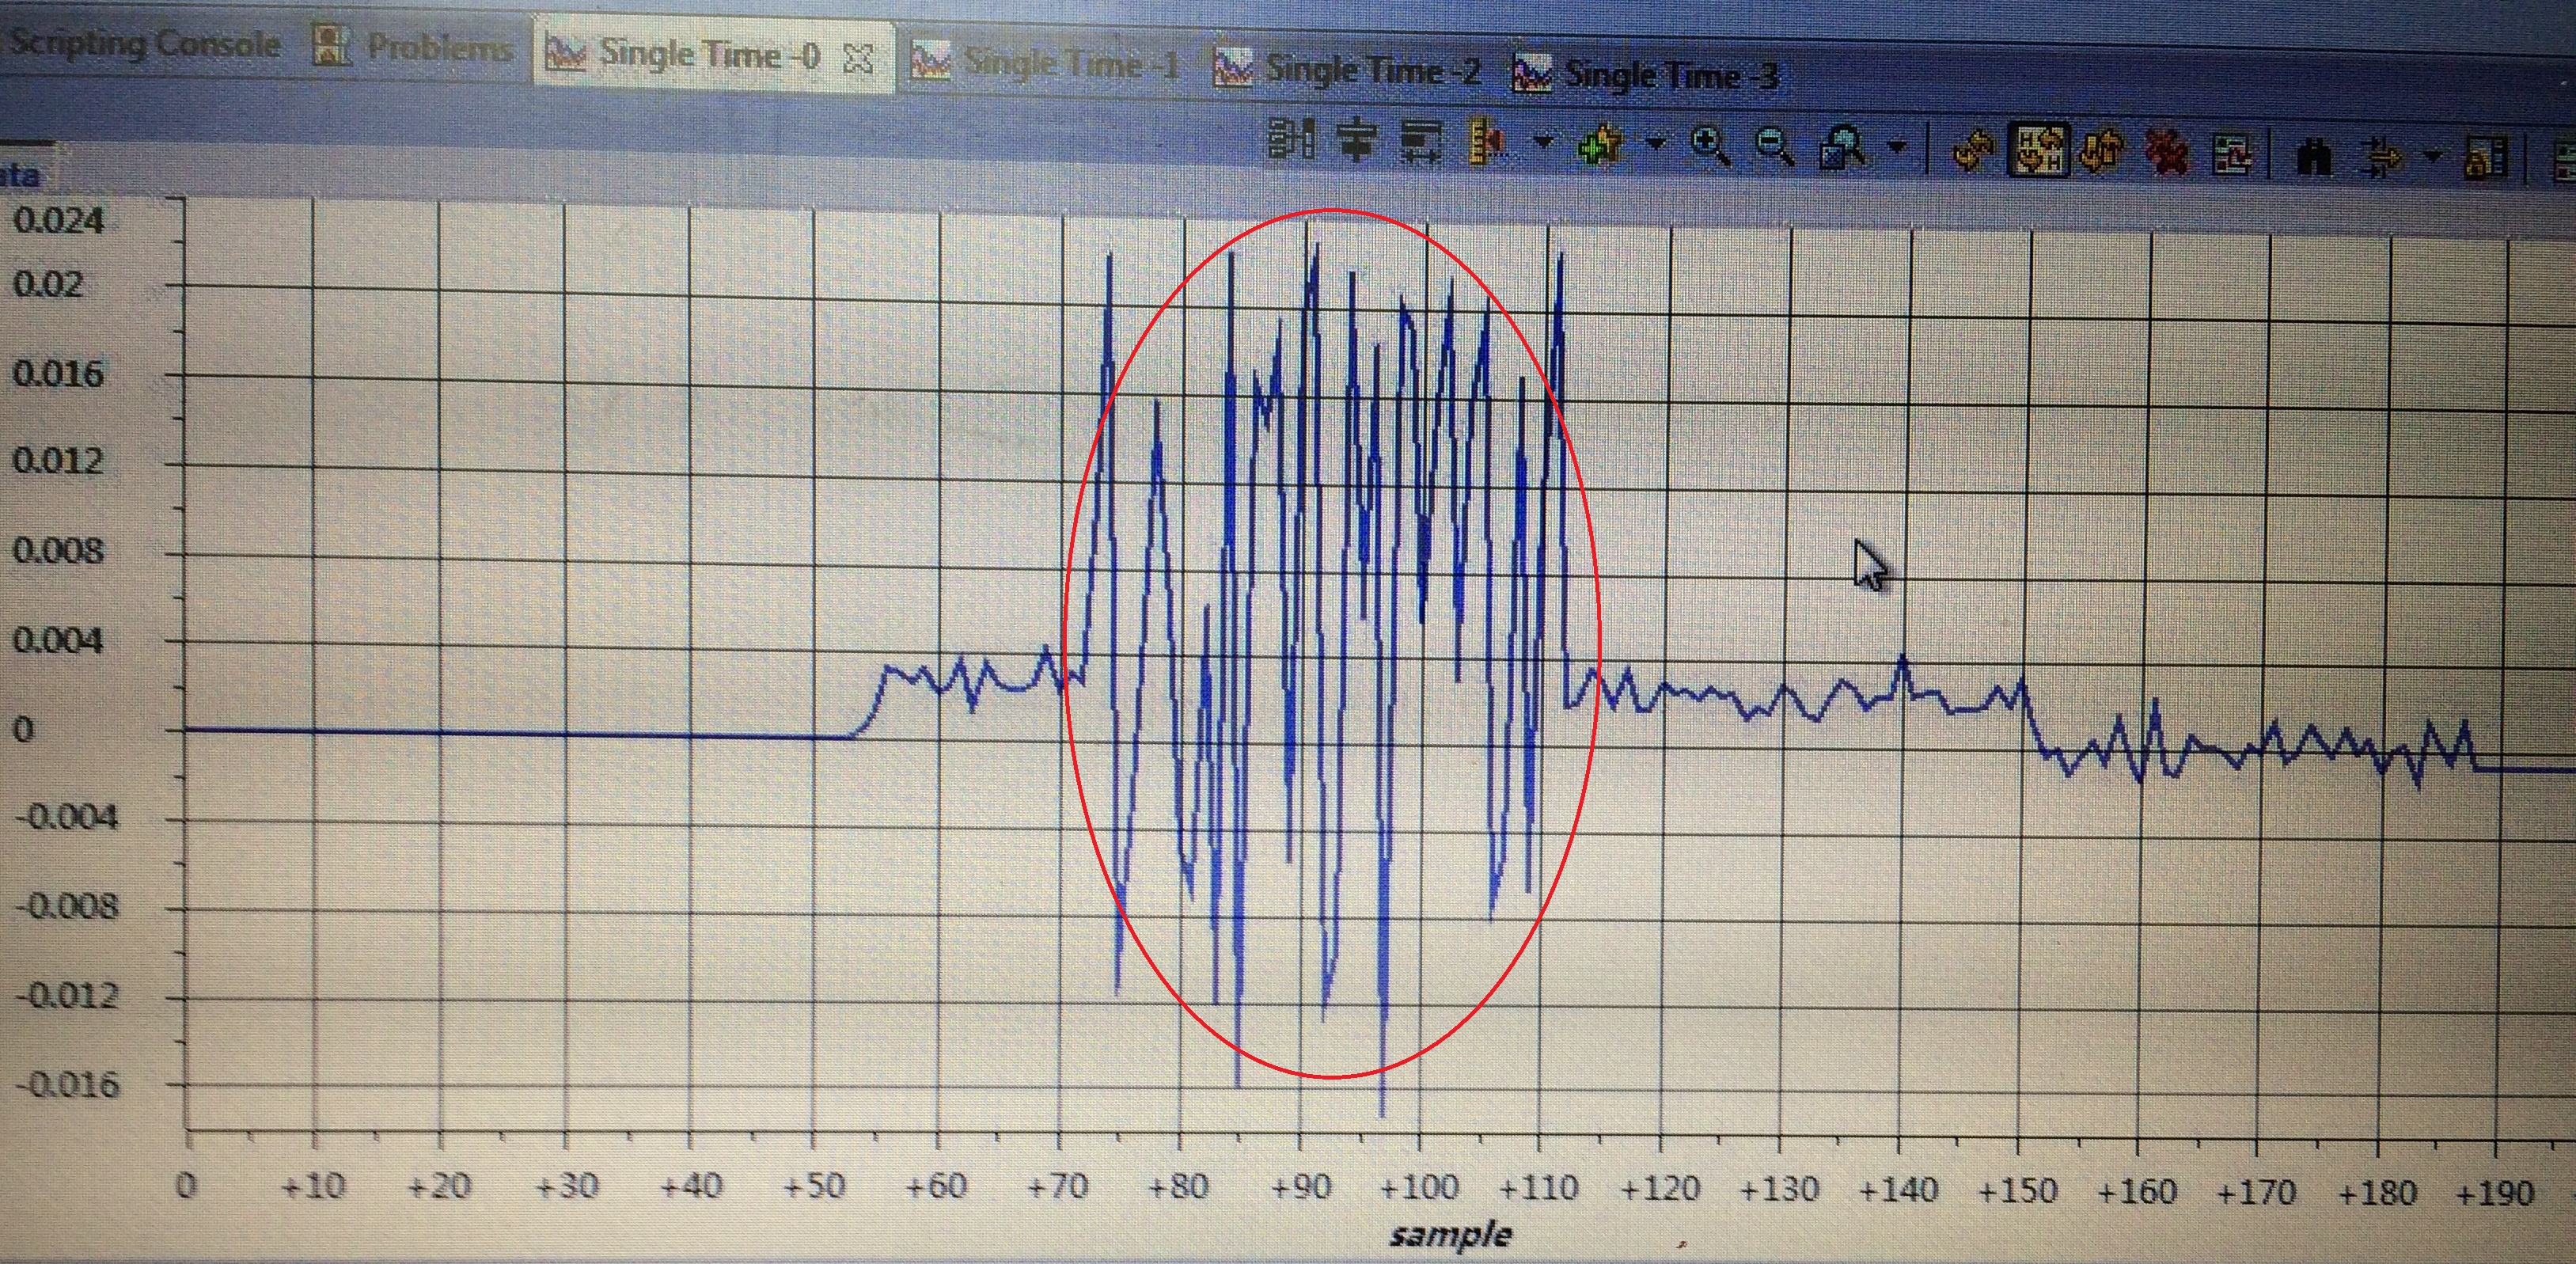
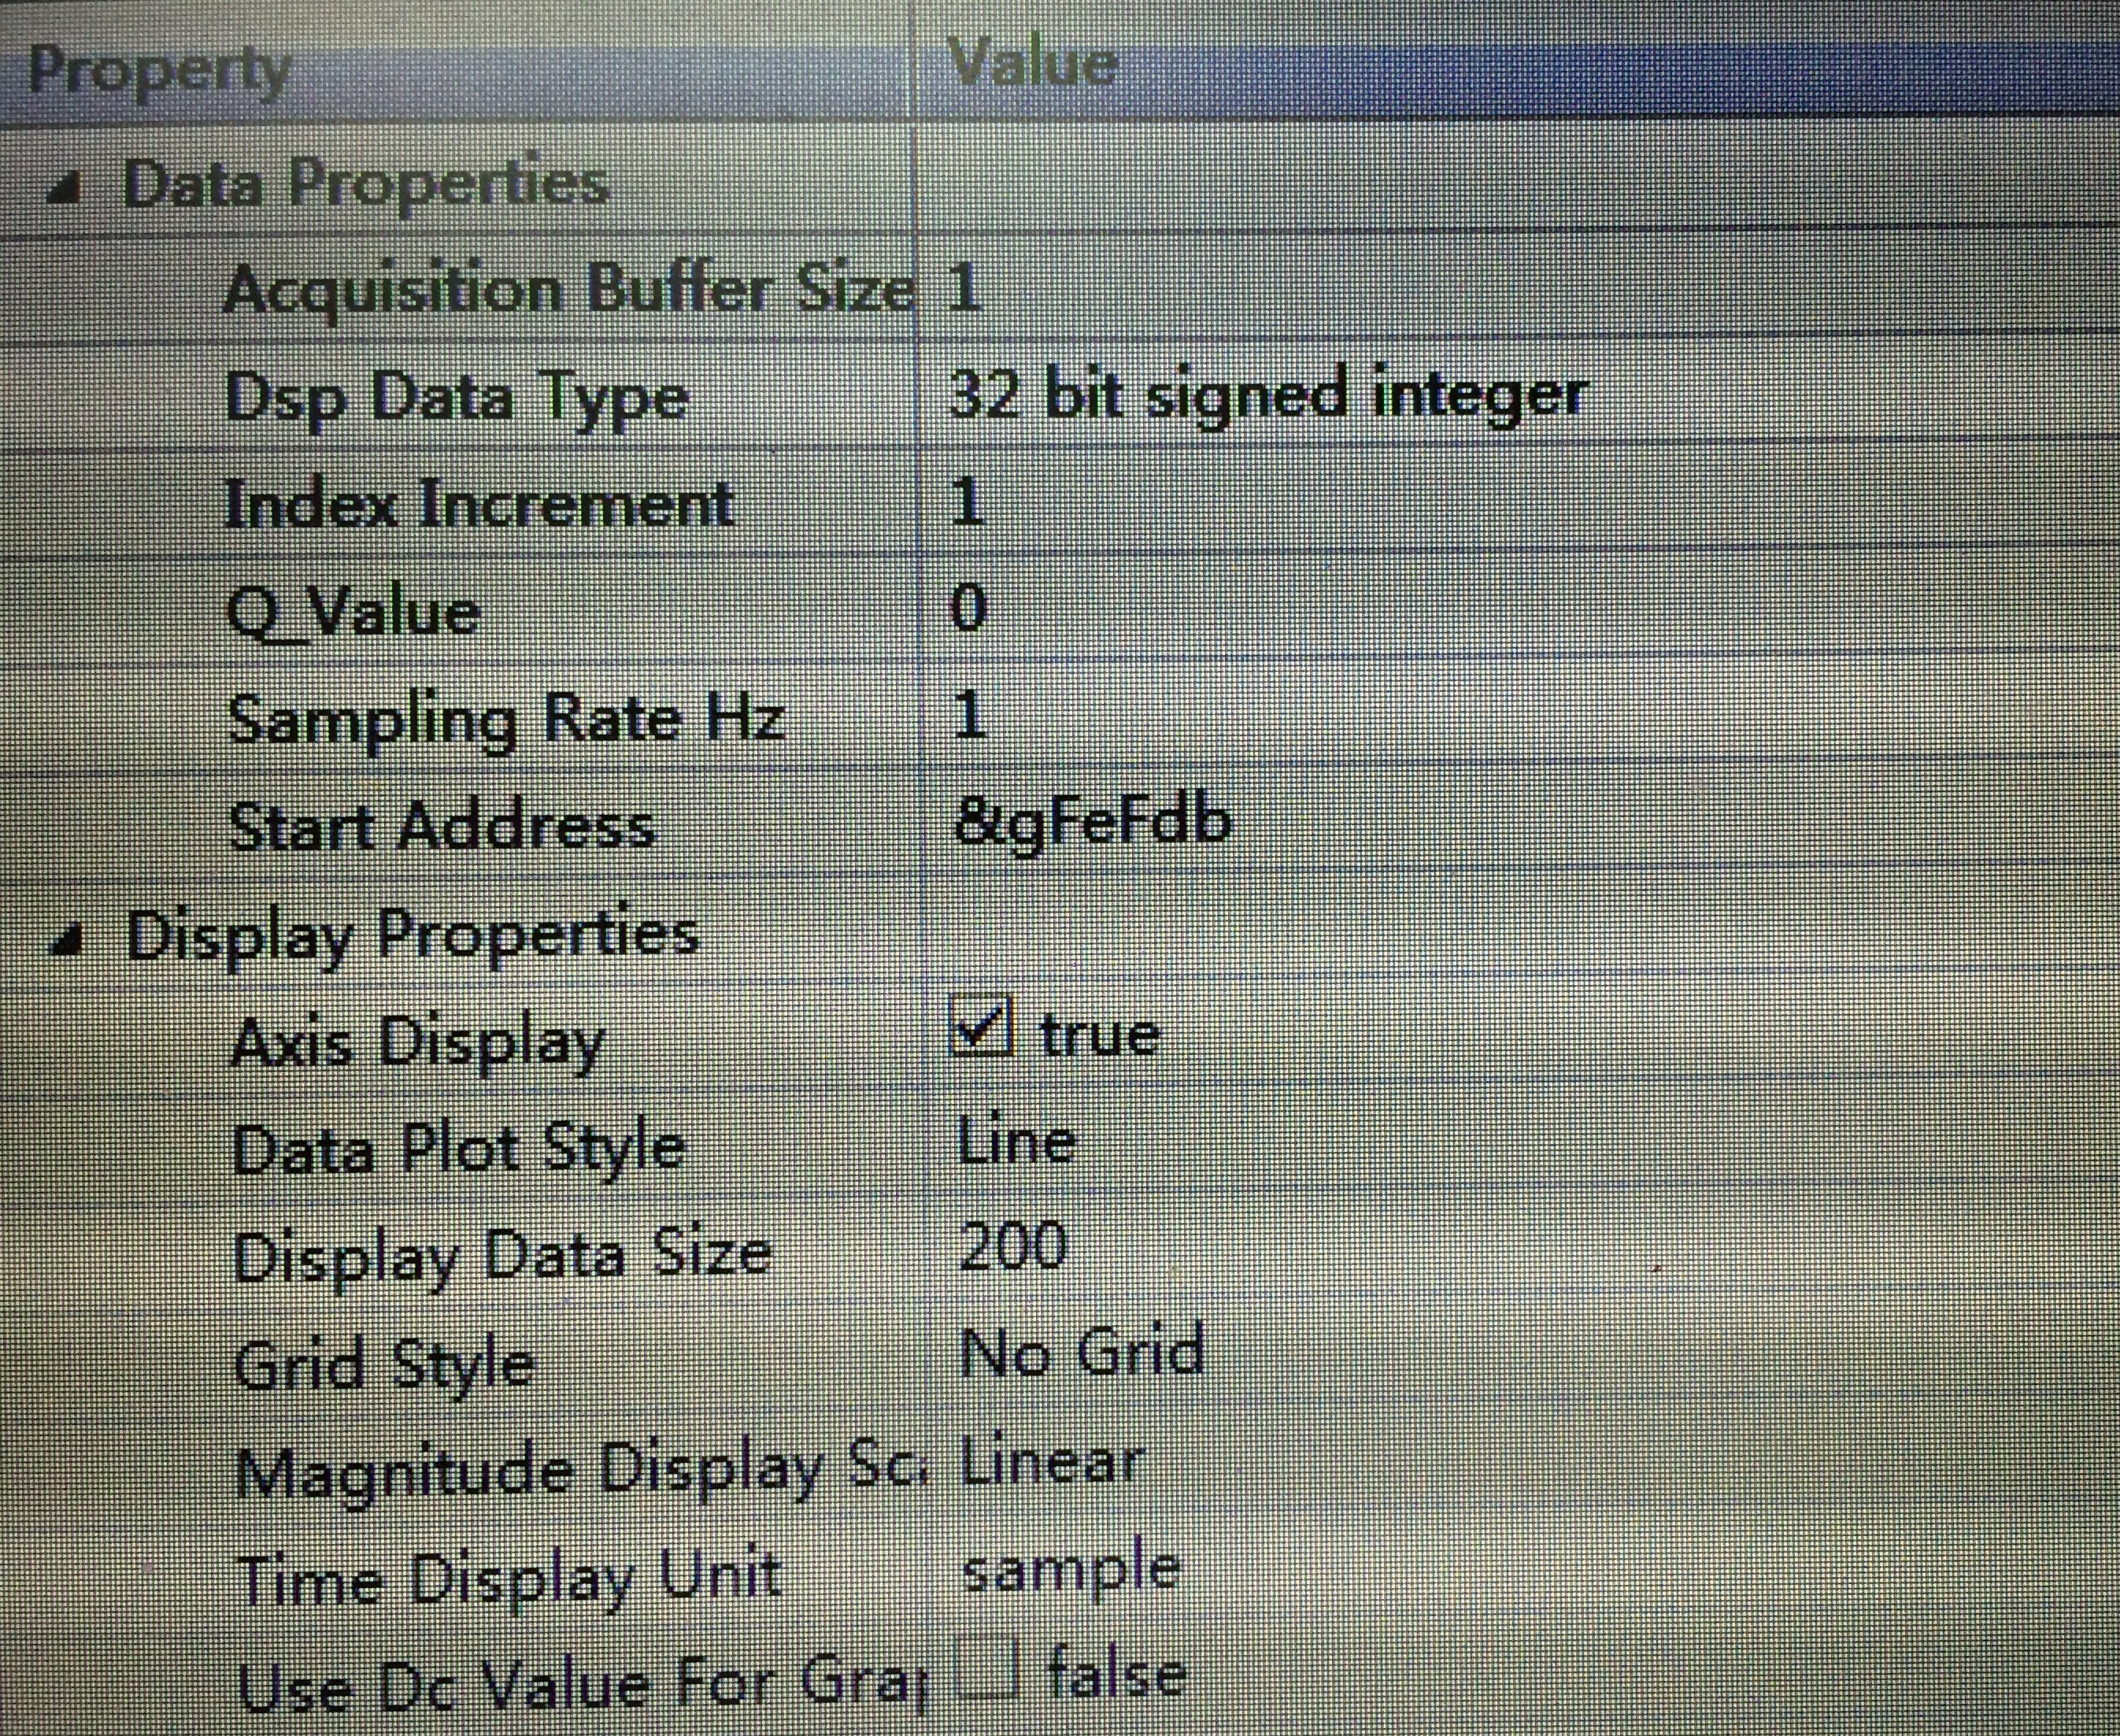
For viewing the sine changed curve, how to set the graph properties if the variable frequency is 200Hz ?
The part in the red circle is sine changed variable, but in the graph, it is not sine curve.
For viewing the sine changed curve, how to set the graph properties if the variable frequency is 200Hz ?
