


Part Number: TMS320F28379D
Tool/software: Code Composer Studio
I have a problem with debug with XDS100v3. When I try to connect i can see such error in the console:
C28xx_CPU1: Trouble Reading Register ST1: (Error -1044 @ 0x0) The debug probe reported an error. Confirm debug probe configuration and connections, reset the debug probe, and retry the operation. (Emulation package 7.0.188.0)
C28xx_CPU1: GEL: Error while executing OnTargetConnect(): Target failed to read register ST1
at (ST1&~(0x0100)) [f28379d_cpu1.gel:311]
at C28x_Mode() [f28379d_cpu1.gel:89]
at OnTargetConnect()
C28xx_CPU1: Error: (Error -1135 @ 0x853C9) The debug probe reported an error. Confirm debug probe configuration and connections, reset the debug probe, and retry the operation. (Emulation package 7.0.188.0)
C28xx_CPU1: Failed CPU Reset
C28xx_CPU1: Error: (Error -1135 @ 0x853C9) The debug probe reported an error. Confirm debug probe configuration and connections, reset the debug probe, and retry the operation. (Emulation package 7.0.188.0)
C28xx_CPU1: Unable to determine target status after 20 attempts
C28xx_CPU1: Failed to remove the debug state from the target before disconnecting. There may still be breakpoint op-codes embedded in program memory. It is recommended that you reset the emulator before you connect and reload your program before you continue debugging
I have also 2 other project based on the almost the same schematic and the debug is working without any issues.
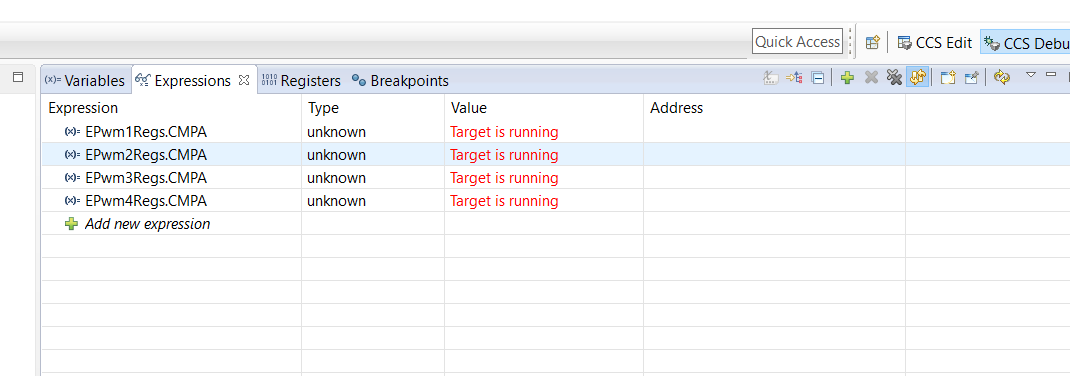
I have found a simple workaround. Firstly I set the switches to TRST=1, GPIO84=0. GPIO72=0 and press reset button before launching debugger. In this situation debugger seems to be working. I can set breakpoints etc. but the expression screen does not work. The Continuous refresh does not works and I see value "Target is running".
In the other projects i set switches to TRST=1, GPIO84=1, GPIO72=1.
What could be a reason of such strange behavior?

