This thread has been locked.

If you have a related question, please click the "Ask a related question" button in the top right corner. The newly created question will be automatically linked to this question.

CCS/LAUNCHXL-F28379D: Why 28379x_RFFT (DSP library) output and MATLAB output differ?

Part Number: LAUNCHXL-F28379D

Tool/software: Code Composer Studio

Hi sir,

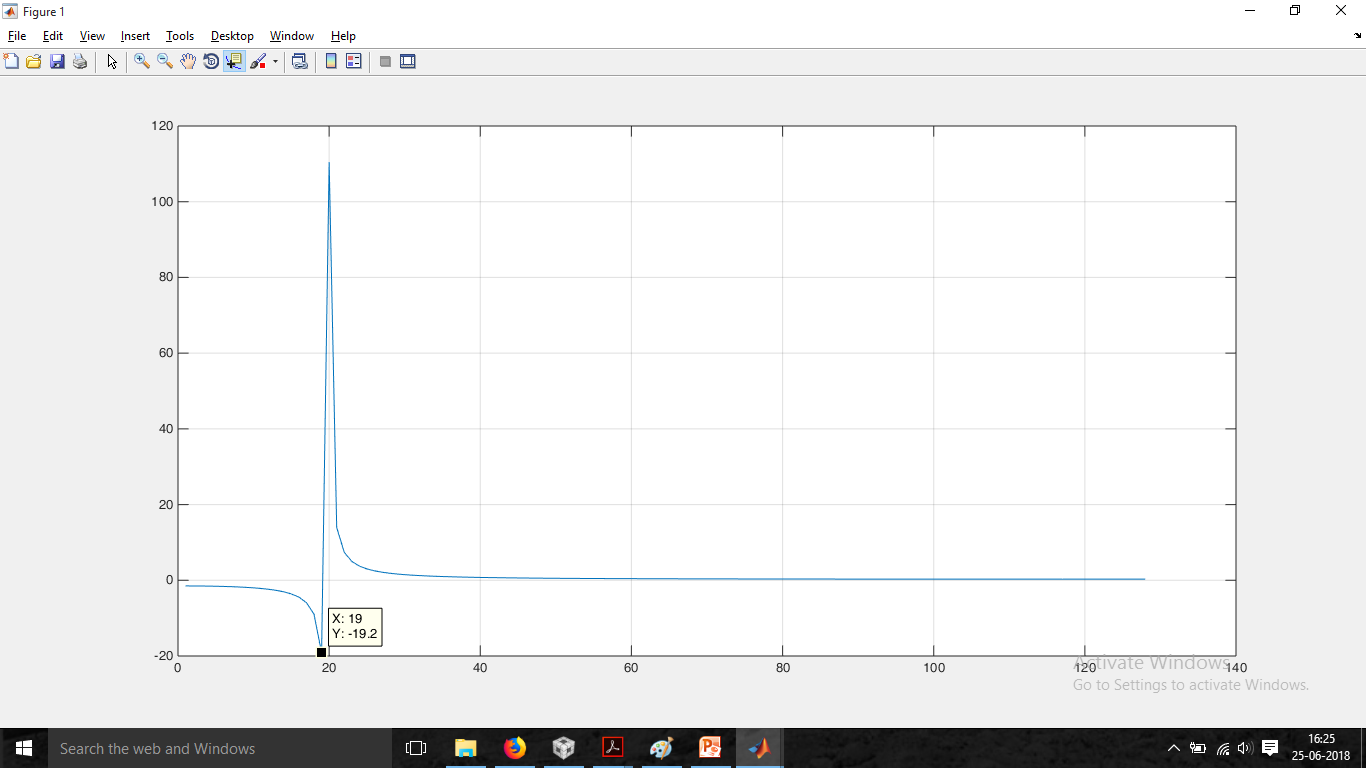
Here, I attached both results and First one is the result generated from matlab and second graph from code composer studio.

  • The data looks the same. You have a peak at 20 in both cases, and the magnitude looks similar. The Matlab sample range is shorter than the data displayed in CCS. Can you check your Matlab script see where it's different from the DSP library implementation?

    Regards,

    Richard
  • Hi Sir,

    you are correct in case of Matlab sample range is shorter than the data displayed in ccs but, CCS output expaned upto 256 samples and it should be at least mirror image of the peak at 20. It is showing some unknown peaks after 230th sample.