This thread has been locked.

If you have a related question, please click the "Ask a related question" button in the top right corner. The newly created question will be automatically linked to this question.

CCS/TMDSHVMTRPFCKIT: TMDSHVMTRPFCKIT

Part Number: TMDSHVMTRPFCKIT

Tool/software: Code Composer Studio

from Sensorless Field Oriented Control of 3-Phase Induction Motors on page 34, we have the real-time graph as shown below. from the graph, the horizontal axis indicates/says samples and the vertical axis has the variable value in per unit. i want to know the operating frequency of the waveforms, i do not get material on how to get the frequency from the real-time graph. but from the graph, i can observe the frequency is approximately 50Hz referring black line below. is this guess possible to know the frequency? if not how could i know it? 
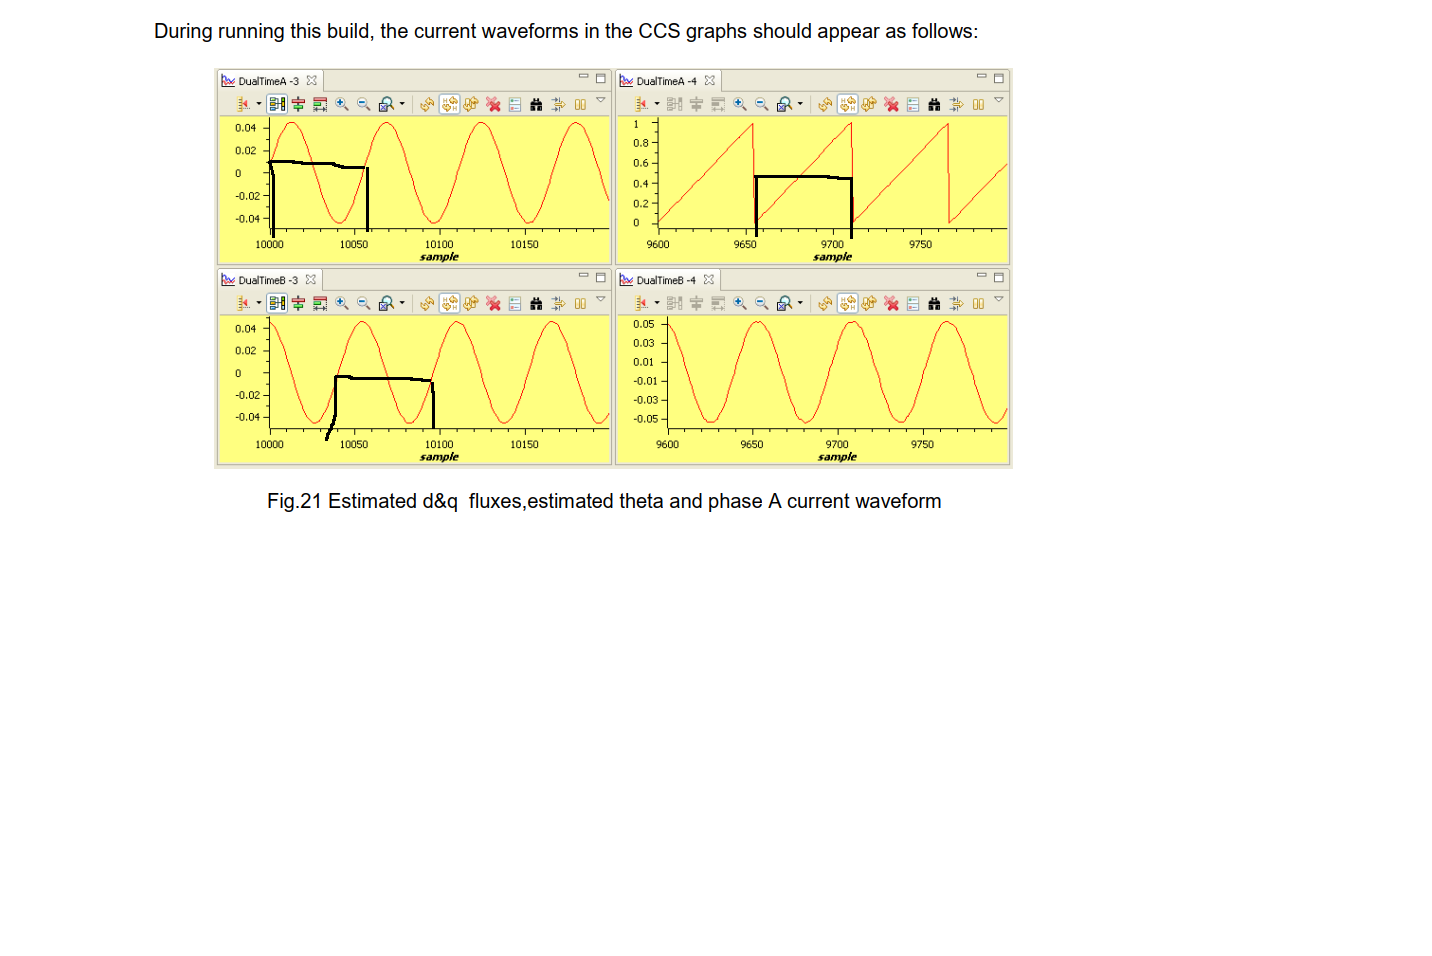
  • The graph is plotted using 200 samples. Each sample is taken once every 5 samples, this is set by the code

    dlog.prescalar = 5;


    This effectively means that one sample is taken every 5 ISRs. If the ISR frequency is 10KHz, then graph sampling rate is 2KHz. From the graph, it appear to take 55 samples per cycle, which is roughly a period of about (55 / 2000) or 27.5ms or a frequency of about 36Hz. Well, this is true if the ISR frequency is 10KHz. I recommend you to review the relevant details as applicable to your test case.


    Hope it helps.