


Part Number: TMS320F28069M
Tool/software: Code Composer Studio
Hello,
I have a question on the debugger display screen of the Code Composer Studio V8.3.0.
In the screen capture image shown below, the graph tool window is displayed in the bottom right half area.
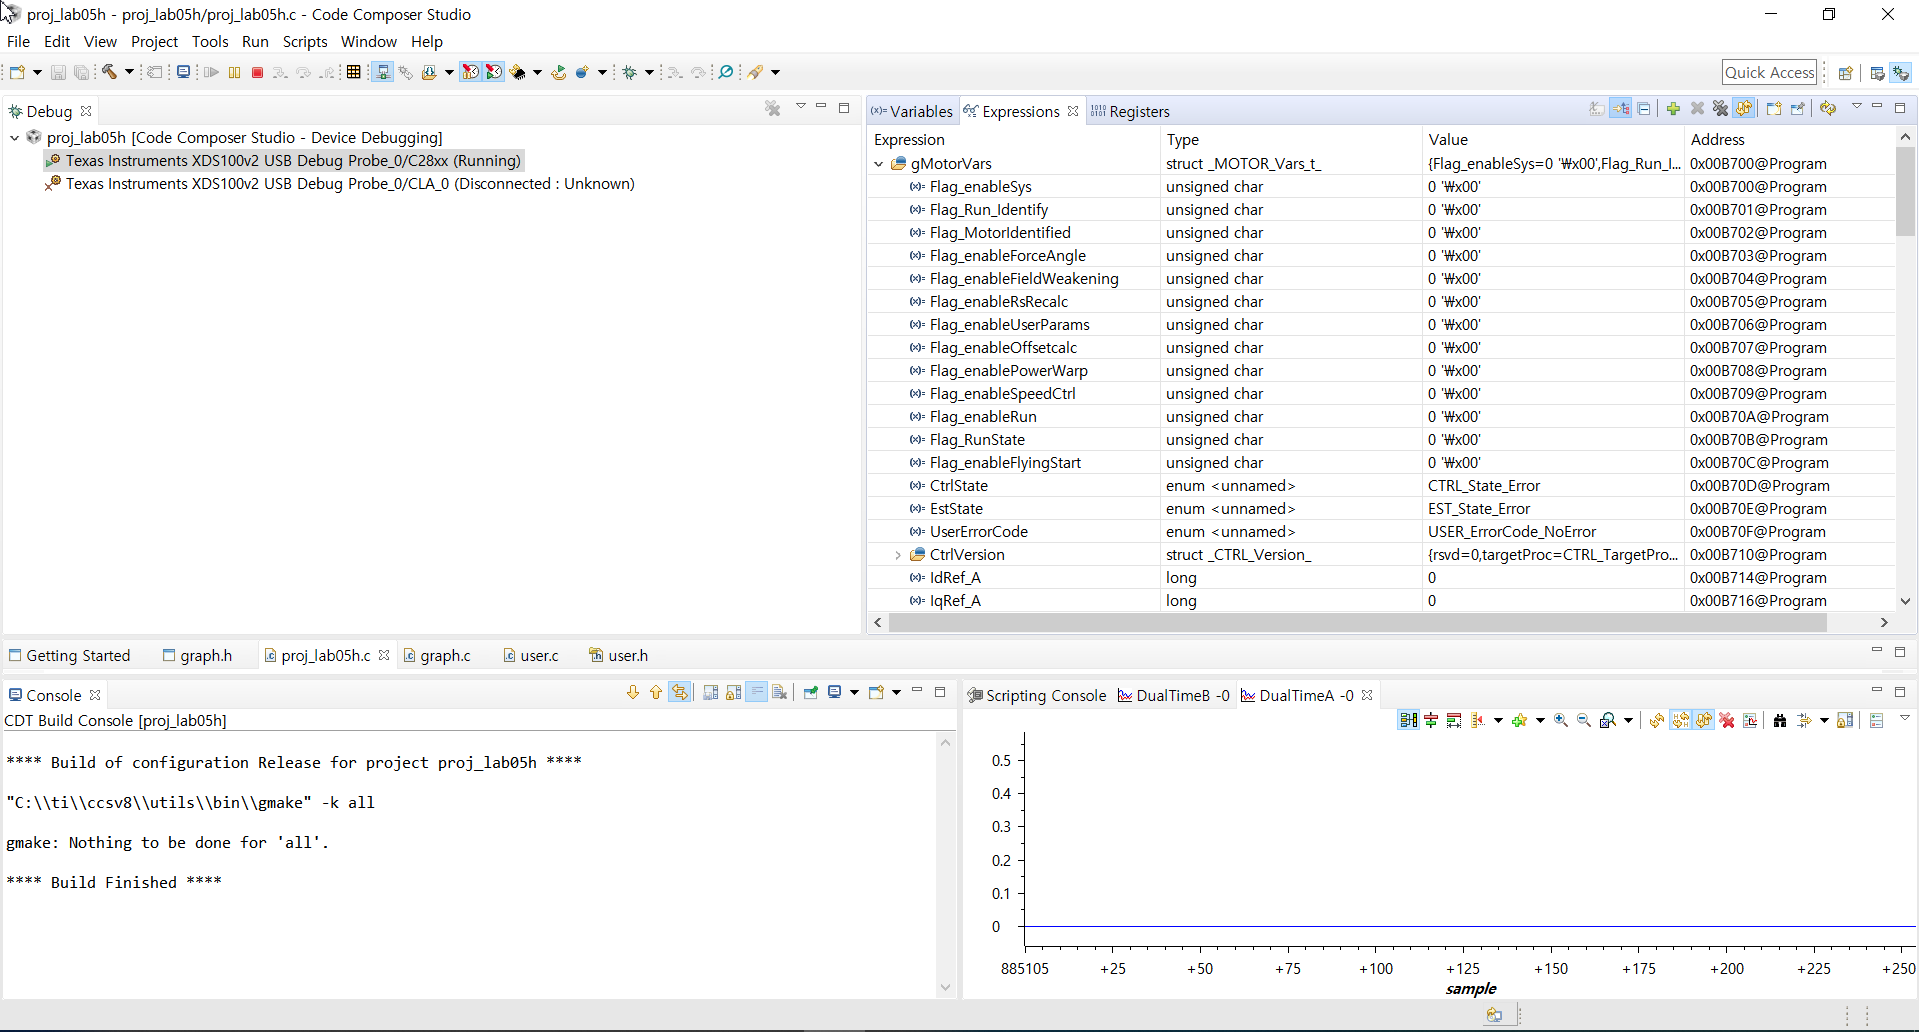
In this captured image, the graph tool displays the plots associated with the DualTimeA variable and the DualTimeB variable separately.
However what I need to do is to display the plots associated with the DualTimeA variable and the DualTimeB variable in one window.
In other words, I need to overlap two plots associated with both DualTimeA variable and DualTimeB variable in one window.
How can I resolve this issue?
Thank you for your guidance.
With regards,
JS Yoo

