This thread has been locked.

If you have a related question, please click the "Ask a related question" button in the top right corner. The newly created question will be automatically linked to this question.

CCS/TMS320F28379D: ADC Conversion Not Working

Part Number: TMS320F28379D
Other Parts Discussed in Thread: LAUNCHXL-F28379D, C2000WARE

Tool/software: Code Composer Studio

I'm a newbie trying to learn to program TI microcontrollers, so I apologize about the simple question.

In the C2000™ MCU 1-Day Workshop,

https://www.google.com/url?sa=t&rct=j&q=&esrc=s&source=web&cd=1&cad=rja&uact=8&ved=2ahUKEwj8-LfftJDoAhVtQt8KHYotDhcQFjAAegQIAhAB&url=https%3A%2F%2Fe2echina.ti.com%2Fcfs-file%2F__key%2Ftelligent-evolution-components-attachments%2F00-56-01-00-00-38-69-26%2FC28x_5F00_Microcontroller_5F00_ODW_5F00_2_2D00_0.pdf&usg=AOvVaw2U14s7h81LaVnWkOVk-gMx

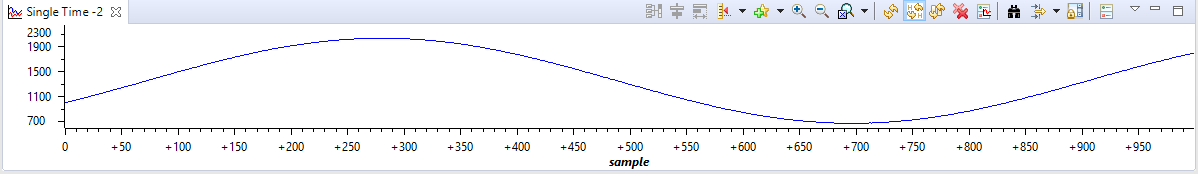
I successfully completed Lab 2 (starting on page 57 of the PDF of the above link).  In this lab, I output a sine wave from of the DAC pins (pin 70 to be precise) and then jumpered that DAC pin to one of the ADC pins (pin 30 to be precise).  This is all working correctly and my plot of the ADC looks like the sine wave shown on page 62 of the PDF.

However, now I'm trying to apply a sine wave from another system (it's coming from a PLECS RT Box).  The sine wave is a 1 kHz sine wave ranging from 0.5 V at the bottom to 1.5 V at the top.  I used an oscilloscope to measure the voltage between pin 30 and GND on the Launchpad, and everything looks as expected on the scope.

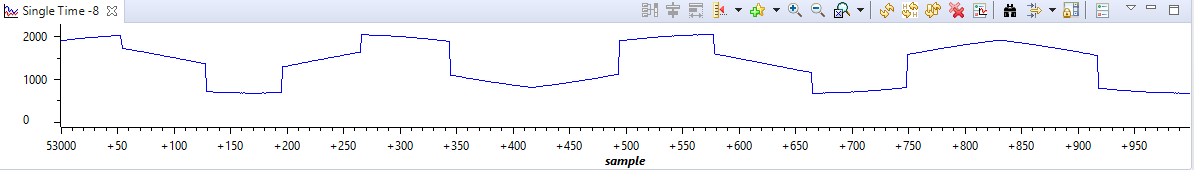
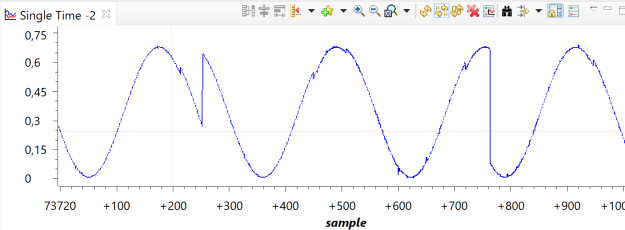
I'm trying to use the unmodified code of Lab2.c to read in this analog input on pin 30.  However, the data I'm reading in from the ADC pin and plotting in Code Composer Studio is very noisy and choppy (and not at all like the nice clean sine wave I'm seeing the scope).  It also looks like the frequency of the data captured is wrong (although it looks like the min and max values are roughly correct.

I'm really baffled as to why the Lab2.c code worked for reading in the signal jumpered from the DAC pin to the ADC pin, but is not working for reading in an external voltage (which looks good on the scope) to the ADC pin.  Is there anything that would need changed in the code when you are reading an external voltage coming from another system rather than a voltage jumpered from the DAC pin of the Launchpad?  

Any help would be greatly appreciated.

Thanks,

Kevin

  • One thing I just thought of:

    Could this problem having something to do with the fact that the PLECS RT Box (through RT Box LaunchPad Interface Board)  is also supplying power to the LaunchPad?

    From the manual of the RT Box Launchpad Interface Board,

    "As the LaunchPad is powered from the interface board no external power supply is required. The interface board contains a linear voltage regulator that converts the 5V supplied by the RT Box down to 3.3V required by the LaunchPad. The pins labeled 5V at pin headers J1 and J5 of the interface board are supplied with 5 V generated by the TI launchpad. Therefore, a 5V output at these pins is only available when a TI launchpad is present."

    Are there certain switch positions or jumpers on the Launchpad that I need to modify because of this?

    (In addition to this power coming from the RT Box, I also still have a USB cable connecting my computer to the Launchpad so that I can graph the data in Code Composer Studio.)

  • Based on page 6 of the LAUNCHXL-F28379D Overview document,

    http://www.ti.com/lit/ug/sprui77c/sprui77c.pdf

    I tried removing JP1 and JP2 from the Launchpad since the PLECS RT Box is supplying an external 3.3 V.  However, now I'm reading a constant 4096 in CCS, so that obviously didn't work.  There must be something else I'm missing. 

  • Kevin,

    In reply to your first post, notice that the ADC for the lab exercises has been configured to perform 'data acquisition'.  The values of the buffer size and sampling rate were chosen based on the sampled signal such that the graph would not scroll, etc.  This use of the ADC differs than an oscilloscope which has a trigger circuit.  So, signals should graph properly if they are multiples of the graph settings specified. As for your 1 kHz signal, it would need to 'fit' the 50 point buffer exactly to display as you would expect it to look.  This probably explains the issue you are experiencing.

    I am not familiar with the 'PLECS RT Box', but from my explanation above the issue may not be the box.

    Also, when you complete the 1-day workshop, I suggest working on the full version of the workshop next.  It is different and I think you will learn a lot more about the device, too.

    https://training.ti.com/c2000-f2837xd-microcontroller-workshop?context=1137791-1137781

    I hope this helps. If this answers your question, please click the green "Verified Answer" button. Thanks.

    - Ken

  • Ken,

    Thanks for your reply.  However, I'm not sure I'm following what you mean in the first paragraph.  Are you saying I should modify the 256 element buffer to be a 50 element buffer? 

    Sampling a 1 kHz sine wave at a 50 kHz sampling rate would mean that there would be 50 samples in a period.  However, if my buffer consists of 256 elements (as in the Lab2.c example), wouldn't that just mean I see slightly over 5 periods in the graph window?  How does that cause the choppiness in the figure from my original post?   (Also, examining the figure above, there are 6.5 periods in the 256 samples when I would expect there to be 5.12 periods in the 256 samples.) 

    Also, just to clarify the 'PLECS RT Box' mates to the J1-J8 pins (pins 1-80) on the Launchpad.  The mating connector on the PLECS RT Box

    -already has 3.3 VDC between pin 1 (+3.3VDC) and pin 60 (GND), even without the Launchpad mated to it

    - has 0 VDC between pin 21 (+5 VDC) and pin 60 (GND) without the Launchpad mated to it

    Given this, what jumpers should I have installed on the Launchpad?

    Thanks,

    Kevin

  • Kevin,

    You are correct, the one-day workshop uses a buffer size of 256, I was thinking about the full workshop which uses a buffer size of 50.  In any case, the same logic applies.  The DAC in the lab exercise will generate 32 points of a sine wave from the quadrature look-up table.  (Note that the quadrature look-up table in this workshop contains 5 quadrants for generating sine and cosine waveforms).  The ADC buffer size is 256, and therefore 8 cycles will be displayed as shown in step 27 on page 62.  The DAC and ADC are perfectly synchronized (periodic) and the waveform looks as expected.  (In the full workshop we generate 25 point of a sine wave with an ADC buffer size of 50, which gives us 2 cycles in the graph).

    So, at this point the workshop is displaying the sine wave that you expected.  Remember, this is purely a synchronized data acquisition capture system.  That is, each point that is generated has a single place in the buffer.  Also, your oscilloscope is displaying the externally generated 1 kHz sine wave as expected (which uses a 'waveform' trigger circuit to display the waveform).  This externally generated sinewave is most likely varying very slightly (you would need to check the specifications of your signal generator) and this should explain why the graphic looks like it does compared to the ADC buffer (without a waveform trigger).

    Earlier, I mentioned that the ADC buffer was carefully selected to be an multiple integer to ensure that the waveform is displayed as expected and without scrolling.  This is important for displaying the waveform in the CCS graph window.  As an experiment you could try changing the buffer size.  Also, note that the CCS update rate is very slow compared to an oscilloscope.

    I hope this helps. If this answers your question, please click the green "Verified Answer" button. Thanks.

    - Ken

  • Ken,

    Thanks for your reply. 

    I changed the code so that now the buffer size is 1000.  (I'm still sampling at 50 kHz.)

    When I apply an external 50 Hz sine wave to the ADC pin, I see exactly 1 period in those 1000 samples as expected and the graph in CCS looks good.

    When I change the external sine wave to be 60 Hz instead (leaving everything else the same), I would expect to see a little over 1 period in those 1000 samples.  Instead, the graph in CCS becomes extremely choppy and looks like it's showing about 4 periods. 

    Does reading in analog signals in CCS only work when the buffer size is an integer multiple of the sampling frequency divided by the signal frequency??  This seems very restrictive.  There are going to be many applications where I don't know ahead of time what the signal frequency is exactly.

    Thanks,

    Kevin

  • Kevin,

    The reason the top graph looks as expected is because sampling a 50 Hz signal at a 50 kHz sampling rate will perfectly fill a buffer size of 1000.  That is exactly my point of how the graph properties were chosen for the workshop.  The reality is no one working on a real design would ever use the graph window for this purpose.  The reason we are using the graph window in the workshop like this is to make the materials self-contained and not dependent upon any external equipment.  This way, no matter what your background experience is, or knowledge of how to use test equipment, you can still learn about C2000 device.  The graphing feature in CCS was never designed to replace an oscilloscope, and again no one would typically use it this way.

    I hope this helps. If this answers your question, please click the green "Verified Answer" button. Thanks.

    - Ken

  • Ken,

    Thanks for your reply. 

    1.   If the buffer size is not an integer multiple of the sampling frequency divided by the signal frequency, I can see that there would always be a discontinuity in the graph.  (For example, when resultsIndex loops back to 0, the new 0th index value of AdcaResults would now no longer be continuous to the old 1st index value of AdcaResults.  Then, when resultsIndex goes to 1, the new 1st index value of AdcaResults would now no longer be continuous with the old 2nd index value of AdcaResults, and so on.)  But I would expect the rest of the graph to look like a good sinusoid with the exception of that one discontinuity.  What am I missing here?  

    2.  You mentioned that no one would on a real design would ever use the graph feature.  If, during the course of building or tweaking my digital controller I wanted to take a look at intermediate stages in my controller (for example the output of a digital low-pass filter or the output of a lag compensator), how would I view those signals?  I'm a total newbie with programming the TI microcontrollers, so I'm just trying to learn how experienced users on a real design would do that.

    Thanks,

    Kevin

  • Kevin,

    Yes, if the buffer size is not an integer multiple of the sampling frequency there would be a discontinuity.  If you select the right non-integer multiple the graph display would move/scroll.  In CCS the graphing window and memory window are useful features, but for real-time debug they are very slow (e.g. 10 Hz refresh rate) and this could be limiting.  By the way, other useful debug features in CCS include the Memory Browser window which is especially handy when single-stepping your code and watching a memory location change.  Also, the Variables window is used to view the local variables for the code function currently being executed and the Expressions window is used to view global variables.  This is covered in the first lab exercise (lab 2) in the full workshop.

    Specific to your question, there are other simulation tools available (e.g. The Mathworks) which are used for real-time system design, as well as hardware test equipment (e.g. oscilloscope).  I will ask one of my colleagues with more experienced with these type of simulation tools to reply to your question: "If, during the course of building or tweaking my digital controller I wanted to take a look at intermediate stages in my controller (for example the output of a digital low-pass filter or the output of a lag compensator), how would I view those signals?"

    - Ken

  • Ken,

    Why does the entire graph of the 60 Hz signal look worse than just one discontinuity though?  I'm not sure if the pictures I paste on here are visible or not, but the entire graph of the 60 Hz signal looks bad and distorted.

    I would expect that at any particular instant of time when I hit the "refresh" button on the graph (not the "continuously refresh" button), that there would be one discontinuity in the graph and that the point of that discontinuity on the graph would vary depending on the value of the resultsIndex variable at the time I hit the refresh button.  

    But I would think that before and after that discontinuity, the graph would look like parts of a sine wave at the correct frequency.  Clearly, looking at the above graph, that's not the case though. What am I missing here that is causing all this distortion through the entire waveform?

    Thanks,

    Kevin

  • Kevin,

    In regard to the question: "If, during the course of building or tweaking my digital controller I wanted to take a look at intermediate stages in my controller (for example the output of a digital low-pass filter or the output of a lag compensator), how would I view those signals?"

    You would go about this in a similar way to the workshop lab.  First, a buffer is allocated to hold the ADC results, then the results are written sequentially into the buffer in the ISR.  If you wanted to log a different variable, such as a controller output for example, you could simply replace the value written to the buffer, or set up a separate buffer and do the same thing.  

    The controllers in the C2000 Digital Control Library in C2000Ware have provision for internal signals to be monitored through a test-point variable in a support structure.  There are also data loggers of various types.  I suggest looking at that once you are a bit further along.

    I hope this helps.

    Regards,

    Richard

  • Richard,

    Thanks for your reply.  The issue I'm having though is that the data displayed on the graph looks totally incorrect when the buffer size is not an integer multiple of the sampling frequency divided by the signal frequency

    Using the Lab 2 workshop code, I changed the code so that now the buffer size is 1000.  (Everything else is the same.  I'm still sampling at 50 kHz.)

    When I apply an external 50 Hz sine wave to the ADC pin, I see exactly 1 period in those 1000 samples as expected and the graph in CCS looks good.

    When I change the external sine wave to be 60 Hz instead (leaving everything else the same), I would expect to see a little over 1 period in those 1000 samples.  Instead, the graph in CCS becomes extremely choppy and looks like it's showing about 4 periods. 

    I don't understand why the graph looks this distorted. 

    If the buffer size is not an integer multiple of the sampling frequency divided by the signal frequency, I can see that this would cause there to always be a discontinuity in the graph.  (For example, when resultsIndex loops back to 0, the new 0th index value of AdcaResults would now no longer be continuous to the old 1st index value of AdcaResults.  Then, when resultsIndex goes to 1, the new 1st index value of AdcaResults would now no longer be continuous with the old 2nd index value of AdcaResults, and so on.)

    So I would expect that at any particular instant of time when I hit the "refresh" button on the graph, that there would be one discontinuity in the graph and that the point of that discontinuity on the graph would vary depending on the value of the resultsIndex variable at the time I hit the refresh button.  

    But I would think that before and after that discontinuity, the graph would look like parts of a sine wave at the correct frequency.  Clearly, looking at the above graph, that's not the case though. What am I missing here that is causing all this distortion through the entire waveform?

    Any help in understanding this would be greatly greatly appreciated.

    Thanks,

    Kevin

  • Kevin,

    In your graph properties (p.60 of the workshop manual), can you tell me what you have "Acquisition Buffer Size" and "Display Data Size" set to please?

    Regards,

    Richard

  • Richard,

    I set the acquisition buffer size and the display data size to both be 1000 in the graph properties.  (Also, as I mentioned in my previous post, I changed RESULTS_BUFFER_SIZE from 256 to 1000 in the Lab2_cpu01.c code.)

    Thanks,

    Kevin

  • Richard,

    One other thing I wanted to add: I'm using a PLECS RT Box to apply the 50 or 60 Hz signal to the ADCINA0 pin (pin 30) on the Launchpad

    The PLECS RT Box mates to the J1-J8 pins (pins 1-80) on the Launchpad.  The mating connector on the PLECS RT Box

    -already has 3.3 VDC between pin 1 (+3.3VDC) and pin 60 (GND), even without the Launchpad mated to it

    - has 0 VDC between pin 21 (+5 VDC) and pin 60 (GND) without the Launchpad mated to it

    Given this, what jumpers should I have installed on the Launchpad?

    Based on page 6 of the LaunchXL-F28379D Overview document,

    http://www.ti.com/lit/ug/sprui77c/sprui77c.pdf

    I tried removing JP1 and JP2 from the Launchpad since the PLECS RT Box is supplying an external 3.3 V.  However, after doing that I was reading a constant 4096 in CCS, so that obviously wasn't the correct thing to do.

    Just want to make sure, what jumpers should I have installed?

    Thanks,

    Kevin

  • Kevin,

    I have an experiment for you to try.  In the ADC ISR modify the buffer as follows:

    // Read the ADC result and store in circular buffer
    // AdcaResults[resultsIndex++] = AdcaResultRegs.ADCRESULT0; <MOVE BELOW AND COMMENT OUT THIS LINE>
     if(RESULTS_BUFFER_SIZE <= resultsIndex)
     {
      AdcaResults[resultsIndex++] = AdcaResultRegs.ADCRESULT0; <LINE FROM ABOVE MOVED HERE> 

    // resultsIndex = 0; <COMMENT OUT>
     }

    Please share the graph results.

    - Ken

  • Ken,

    With that code, no data ever gets stored in AdcaResults because resultsIndex never increments and thus never becomes larger than RESULTS_BUFFER_SIZE.  Hence AdcaResults remains all 0s.

    Thanks,

    Kevin

  • Kevin,

    Sorry, it should have been:

    if(RESULTS_BUFFER_SIZE >= resultsIndex)

    So, the ISR code section should look like:

    // Read the ADC result and store in circular buffer
    // AdcaResults[resultsIndex++] = AdcaResultRegs.ADCRESULT0; <MOVE BELOW AND COMMENT OUT THIS LINE>
    if(RESULTS_BUFFER_SIZE >= resultsIndex) <CHANGE FROM "<=" to ">=">
     {
      AdcaResults[resultsIndex++] = AdcaResultRegs.ADCRESULT0; <LINE FROM ABOVE MOVED HERE> 

    // resultsIndex = 0; <COMMENT OUT>
     }

    This will only fill the buffer one time.  Please share the graph results.

    - Ken

  • Yeah, that works when filling the buffer only one time.

    However, why does the waveform look so bad when re-filling the buffer?  (Like I said before, I understand that there would be one discontinuity, but I don't understand why the rest of the waveform is so bad.)

    Thanks,

    Kevin

  • Kevin,

    Good, this is how the ADC is typically used in an application (that is, not being buffered).  Next, you could try 'continuous refresh' and see if the graph scrolls.  I think the issue you experienced is CCS trying to graph the buffer as it is constantly being updated.  If you would like, I could have this thread reassigned to the CCS team for further explanation.

    - Ken

  • Ken,

    No new data comes in when I hit the continuous refresh.  With the modified code you sent, only the first 20 ms of data when the debug is run ever gets stored in AdcaResults.  

    I would appreciate if you could reassign this issue to the CCS team for further explanation.

    Thanks,

    Kevin

  • Kevin,

    For continuous refresh you need to revert the ADC ISR code back the way it was before we modified it.  Does it now scroll?  Let me know, and then I will reassign this to the CCS team.  Thanks.

    - Ken

  • Ken,

    When I revert back to the original code, I see the same incorrect behavior as before. 

  • Kevin,

    Ok, thanks.  I will have this thread sent to the CCS team for further explanation.  Please wait for their reply.

    - Ken

  • Kevin,

    Sorry for the delay in response. Currently many of us are working from home and I didn't have the appropriate hardware with me to try this with. I was able to return to the office to pick up a related target and hope to try this out shortly. When I have some updates, I'll be sure to share them with you.

    Thansk

    ki

  • Kevin - can you also provide which exact version of CCS you are using?

  • I'm using Version: 9.3.0.00012.

    Just to recap in case you don't want to go back through the entire thread, the issue I'm having though is that the data displayed on the graph in CCS looks totally incorrect when the buffer size is not an integer multiple of the sampling frequency divided by the signal frequency

    Using the Lab 2 workshop code, I changed the code so that now the buffer size is 1000.  (Everything else is the same.  I'm still sampling at 50 kHz.)

    When I apply an external 50 Hz sine wave to the ADC pin, I see exactly 1 period in those 1000 samples as expected and the graph in CCS looks good.

    When I change the external sine wave to be 60 Hz instead (leaving everything else the same), I would expect to see a little over 1 period in those 1000 samples.  Instead, the graph in CCS becomes extremely choppy and looks like it's showing about 4 periods. 

    I don't understand why the graph looks this distorted. 

    If the buffer size is not an integer multiple of the sampling frequency divided by the signal frequency, I can see that this would cause there to always be a discontinuity in the graph.  (For example, when resultsIndex loops back to 0, the new 0th index value of AdcaResults would now no longer be continuous to the old 1st index value of AdcaResults.  Then, when resultsIndex goes to 1, the new 1st index value of AdcaResults would now no longer be continuous with the old 2nd index value of AdcaResults, and so on.)

    So I would expect that at any particular instant of time when I hit the "refresh" button on the graph, that there would be one discontinuity in the graph and that the point of that discontinuity on the graph would vary depending on the value of the resultsIndex variable at the time I hit the refresh button.  

    But I would think that before and after that discontinuity, the graph would look like parts of a sine wave at the correct frequency.  Clearly, looking at the above graph, that's not the case though. What am I missing here that is causing all this distortion through the entire waveform?

    Thanks,

    Kevin

  • Kevin,

    I will have to test this with the workshop project and fortunately I got my F28379D controlCARD with me.

    Coincidentally enough, yesterday I was testing a very similar scenario (different code and platform) and took the screenshot below. 

    I had graphed it with various frequencies from 40 to 400Hz. This rules out any intrinsic issue with the graph tool of CCSv9.3. 

    The last waveform you sent is quite strange and it surely gives the impression you described - some undersampling or insufficient buffering. I can't help but wonder if somehow the graph settings reset or something along these lines. 

    I will get back to this thread with my tests with the F28379D controlCARD. 

    Regards,

    Rafael

  • Kevin,

    I couldn't find the workshop lab files that correspond to the PDF file you sent, but I was able to download the F2837xD Microcontroller Workshop mentioned by Ken and tested the workshop project Lab7 with both the Acquisition buffer size of 50 and 1000 (I had to slightly modify the allocation to fit in memory).

    I also set up a breakpoint at line 188 of the file <DefaultIsr_7.c> to see the AdcBuf contents at the end of a complete data acquisition.

    Optionally, I set its properties to Update the Graph View (instead of halting), so I could view the waveform being updated continuously. 

    All that only to see that the graph was correctly updated at any frequency rate, as shown in the short clip below (same 40~400Hz). 

    I am using the same CCSv9.3 but with a F28379D controlCARD connected via its embedded XDS100v2 Debug Probe. 

    With this, I am unsure what may be happening in your setup. If you want to test the same conditions, please check the attached project I am using, as well as the graph properties (they must be loaded after the code is loaded). It should work just fine with the LAUNCHXL-F28379D as well. 

    Hope this helps,

    Rafael

    Lab7_F28379D.zip

    https://e2e.ti.com/cfs-file/__key/communityserver-discussions-components-files/171/Lab7_5F00_F28379D.graphProp

  • Rafael,

    The lab files for the PDF I sent are located here: https://training.ti.com/c2000-f2837xd-microcontroller-1-day-workshop-series.  In that link I'm using the lab files for Lab 2.

    Does the graph display correctly for you without the Update View breakpoint?  I am not using any breakpoints when running so that might be causing a difference.


    Also in the Lab 2 that I linked above, there is not that "brute force the circular buffer" section of the code.  Can you try running your setup with the Lab 2 and see if you get the same behavior as me?

    Thanks,

    Kevin

  • Kevin,

    Thanks for sending the link. I ran Lab2 solution (no breakpoints) and was able to get a good waveform on the graph tool. I verified both the pre-configured buffer size of 256 and the 1000 samples with the same results. 

    Obviously that some artifacts are still shown given that, the moment the target is manually halted, the buffer may be half-way filled. 

    The breakpoint I described before allows updating the graph only when the buffer is complete, thus avoiding this artifact. If you want to set up this breakpoint, set it at line 157 of the file <Lab2_cpu01.c>.

    However, one interesting detail that I forgot in my previous reply and reproduced here is the relationship between the parameter Display Data Size and the Acquisition Buffer Size. When they are the same, the graph showed is quite good but, if the former is larger than the latter, the discontinuities will be more aggressive since the graph view will store a bit of history of buffer data previously acquired. In this particular case, setting these two parameters as 1024 and 256 respectively would lead to graphs like:

    400Hz:

    50Hz:

    In this case, I suspect that something is somehow changing when you are changing the frequency of the input signal. I really don't know what else could lead to that.  

    For a complete reference on the Graph View, check section 7.7 of the CCS User's Guide at:

    https://software-dl.ti.com/ccs/esd/documents/users_guide/index.html 

    Regards,

    Rafael

  • Rafael,

    Thanks for your reply.  I just want to clarify a few things:

    1.  The only correct-looking plot you posted above looks like a case where the buffer size is such that the graph fills exactly one period of the external ADC signal.  That case is working for me too.   Were you able to get a plot to look correct using the Lab2 code (without any breakpoints) for a case where the graph display a non-integer number of periods (for example, sampling at 50 kHz an external signal of 60 Hz using a buffer size of 1000)?

    2.  In the graph properties, what datatype are you using?  I'm not sure if this is causing any differences, but it doesn't look like you are using 16-bit unsigned integer like in the lab.

    In the graph properties, I'm using the following properties:

    Acquisition Buffer Size: 1000

    Display Data Size: 1000

    Sampling Rate: 50000 Hz

    Data Type: 16-bit unsigned integer

    Start Address: AdcaResults

    If you use these properties, what does your graph look like if you apply an external 60 Hz signal to the ADC pin?

    3.  Did you make any changes to the Lab2_cpu01 code?  The only change I made was to increase the buffer size

    #define RESULTS_BUFFER_SIZE 256    was changed to   #define RESULTS_BUFFER_SIZE 1000

    Did you make any changes other than that?

    Thanks again,

    Kevin

  • Rafael,

    Could you please clarify a few things:

    1.  The only correct-looking plot you posted above looks like a case where the buffer size is such that the graph fills exactly one period of the external ADC signal.  That case is working for me too.   Were you able to get a plot to look correct using the Lab2 code (without any breakpoints) for a case where the graph display a non-integer number of periods (for example, sampling at 50 kHz an external signal of 60 Hz using a buffer size of 1000)?

    2.  In the graph properties, what datatype are you using?  I'm not sure if this is causing any differences, but it doesn't look like you are using 16-bit unsigned integer like in the lab.

    In the graph properties, I'm using the following properties:

    Acquisition Buffer Size: 1000

    Display Data Size: 1000

    Sampling Rate: 50000 Hz

    Data Type: 16-bit unsigned integer

    Start Address: AdcaResults

    Are you using different properties than this?

    3.  Did you make any changes to the Lab2_cpu01 code?  The only change I made was to increase the buffer size

    #define RESULTS_BUFFER_SIZE 256    was changed to   #define RESULTS_BUFFER_SIZE 1000

    Did you make any changes other than that?

    Thanks,

    Kevin

  • Kevin,

    I apologize for the delay; I am quite backed up here due to the change in routine. 

    1. I don't entirely sure why you think the first screen is better than the others. The first screen has a large discontinuity at about sample 50 caused by the discontinuity in the current buffer being filled and the previous one. Sure, the discontinuity is smaller than the other two waveforms, but they have the same root cause.

    Also, as mentioned before, all the plots were obtained with Lab2 and tested with both 256 and 1000 samples in the frequency range between 40 and 400Hz. Breakpoints were sometimes used and sometimes not, depending on the effect I wanted to obtain. One thing is certain: to obtain a good waveform, some sort of synchronism with the buffer fill is required - just like a triggered oscilloscope. 

    2. The only additional setting I added was to normalize the values by using the Q-value of 11 (since it is a 12-bit ADC). I didn't set the sample rate as it does not affect the shape of the waveform. 

    3. No other changes to the code were made.

    I reiterate the reference I sent before is quite thorough with regards to the parameters and settings that shape the waveform.

    Regards,

    Rafael