

Other Parts Discussed in Thread: MSP430F5528, MSP430G2553, MSP430G2452, MSP430F5529, MSP430F5229, MSP430F5510, MSP430F5438A
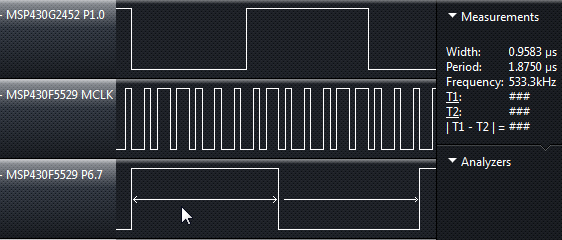
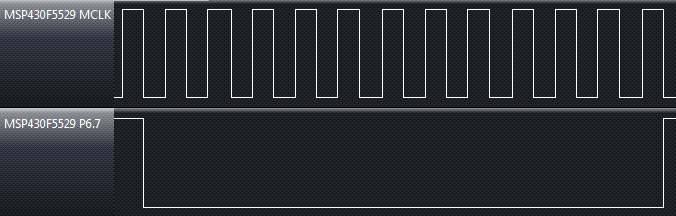
I've been running some tests on a MSP430F5528. I set it to run off the DCO at 8Mhz. then flip a bit in a while loop. On the MSP430F5528 the signal generated from the bit flipping is around 523kHz. While I can see the SMCLK output at 8.5MHz. So my question is how do I know whats taking up the extra processing time? Is there a easy way to find out?
I've ran a similar test on a lauchpad MSP430 (430G2553) and I'm able to flip the bits on the pin and see it actually run at 8mhz. So it's behaving differently (running the while loop much faster). Whats the F5528 doing to make it run the loop slower?
Thanks.
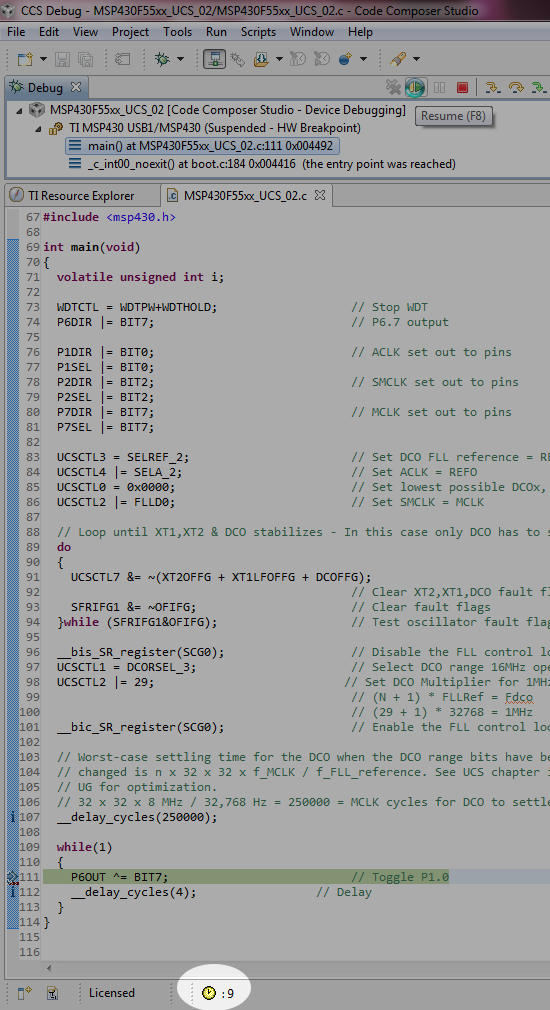
Below is the example code I'm using on the MSP430F5528.
int main(void)
{
volatile unsigned int i;
WDTCTL = WDTPW+WDTHOLD; // Stop WDT
P1DIR |= BIT1; // P1.1 output
P1DIR |= BIT7; // P1.7 output
P1DIR |= BIT0; // ACLK set out to pins
P1SEL |= BIT0;
P2DIR |= BIT2; // SMCLK set out to pins
P2SEL |= BIT2;
//P7DIR |= BIT7; // MCLK set out to pins ... this doesn't work on the MSP430F5528
//P7SEL |= BIT7;
UCSCTL3 = SELREF_2; // Set DCO FLL reference = REFO
UCSCTL4 |= SELA_2; // Set ACLK = REFO
UCSCTL0 = 0x0000; // Set lowest possible DCOx, MODx
// Loop until XT1,XT2 & DCO stabilizes - In this case only DCO has to stabilize
do
{
UCSCTL7 &= ~(XT2OFFG + XT1LFOFFG + DCOFFG);
// Clear XT2,XT1,DCO fault flags
SFRIFG1 &= ~OFIFG; // Clear fault flags
}while (SFRIFG1&OFIFG); // Test oscillator fault flag
__bis_SR_register(SCG0); // Disable the FLL control loop
UCSCTL1 = DCORSEL_5; // Select DCO range 16MHz operation
UCSCTL2 |= 249; // Set DCO Multiplier for 8MHz
// (N + 1) * FLLRef = Fdco
// (249 + 1) * 32768 = 8MHz
__bic_SR_register(SCG0); // Enable the FLL control loop
// Worst-case settling time for the DCO when the DCO range bits have been
// changed is n x 32 x 32 x f_MCLK / f_FLL_reference. See UCS chapter in 5xx
// UG for optimization.
// 32 x 32 x 8 MHz / 32,768 Hz = 250000 = MCLK cycles for DCO to settle
__delay_cycles(250000);
while(1)
{
P1OUT ^= BIT7; // Toggle P1.7
//__delay_cycles(600000); // Delay
}
}


