This thread has been locked.

If you have a related question, please click the "Ask a related question" button in the top right corner. The newly created question will be automatically linked to this question.

RTOS/TM4C1294NCPDT: Event_pend and Semaphore_pend: asserted at "Assert_isTrue((BIOS_getThreadType() == BIOS_ThreadType_Task)"

Part Number: TM4C1294NCPDT
Other Parts Discussed in Thread: SYSBIOS

Tool/software: TI-RTOS

tm4c1294ncpdt
CCS6.1.3
tirtos_tivac_2_10_01_38
compiler: TI V5.1.11
XDC: 3.30.4.52

I have a board running on field. Occassionally the board resets. I added an errorHook to capture the error data, and found it asserted at line 199 of "Event_pend" and line 202 of "Event_pend". Both of them are checking if0358.files.zip it is called by a thread, not HWI/SWI/main.
My code does call both function, but all in tasks. So my questions are:
1. Does this mean other code such as BIOS or drivers calls these function in HWI/SWI? But I searched "Event_pend" in folder "C:\ti\tirtos_tivac_2_10_01_38\packages\ti" and "C:\ti\tirtos_tivac_2_10_01_38\products", and found there seems no calling, except in an example and uia.
2. Is there a way to know who calls a funtion by checking linker output?

The attached are file "event.c", "semaphre.c" and .cfg.

Thanks

  • Jianyi Bao said:
    1. Does this mean other code such as BIOS or drivers calls these function in HWI/SWI? But I searched "Event_pend" in folder "C:\ti\tirtos_tivac_2_10_01_38\packages\ti" and "C:\ti\tirtos_tivac_2_10_01_38\products", and found there seems no calling, except in an example and uia.

    I searched the later tirtos_tivac_2_16_01_14 and also couldn't see any BIOS or driver calls to Event_pend.

    Jianyi Bao said:
    2. Is there a way to know who calls a funtion by checking linker output?

    There is call_graph utility, described in Finding out static stack usage, which as a side effect of determining the maximum stack usage also shows the call graph of a program. Note that call_graph can't automatically follow calls by function pointers unless configuration files are supplied, but does provide warnings if a function makes "indirect calls" via function pointers.

    Jianyi Bao said:
    . I added an errorHook to capture the error data, and found it asserted at line 199 of "Event_pend" and line 202 of "Event_pend". Both of them are checking if(Please visit the site to view this file) it is called by a thread, not HWI/SWI/main.

    Looking at the assertion check, the BIOS_getThreadType() function used in the assertion check retries the thread type from a global variable (BIOS_module->threadType). Therefore, it is possible that the variable which holds the thread type is being overwritten by something (rather than Event_pend being called from a non-task context). Can you run the program under the debugger and check the ROV view for any errors, e.g. for stack overflow?

  • Hi Chester,

    Could you provide some help on how to use "call_graph" in TivaC?

    I downloaded V2.50.00, and when i run it on my xml file, it says "Cannot find entry point. Stopped at script/call_graph.pl line 987.".

    And if I use -e=_c_int00, it says "No .debug_info sections found. Stopped at script/call_graph.pl line 1095."

    I don't know what is wrong.

    file2.zipThe attached is my xml file.

  • Hi Jianyi,

    Have you checked the stacks to make sure they are not overflowed? Here's a good reference to see the best way to check the stacks: training.ti.com/debugging-common-application-issues-ti-rtos

    Todd
  • Jianyi Bao said:
    Could you provide some help on how to use "call_graph" in TivaC?

    You need to run armofd program on the .out file to generate the XML for call_graph, rather than using the linkInfo.xml file produced by the linker.

    E.g.:

    armofd -x -g AP_A7106_Normal.out | call_graph

    See the documentation in the cg_xml installation for more details.

  • Thanks Chester. I can run call_graph now:

    1. first run "armofd.exe" with options "-xg --xml_indent=0 --obj_display=none,header,optheader,symbols,battrs --dwarf_display=none,dinfo" to create xml file.
    2. then run "call_graph"

    And I found some problems:

    1. If I run "call_graph --stack_max", it could get different results: "TcpSocketConnectRequesterTaskFunc : wcs = 2776" or "TcpSocketConnectRequesterTaskFunc : wcs = 3120". If I run "call_graph" without "--stack_max", wcs of this function is 2832. I don't know why.
    2. From the .cfg file I provided above, we could see all task stack size is 4096 (including hwi/swi and idle task, except LowPTask2Func, whose wcs is only 264). So I think there should be sufficient stack for all tasks.
    3. Since stack overflow checking is enabled for tasks and hwi/swi, why a stack overflow error is not raised. Up till now, I didn't see a stack overflow error.

    Today, I saw another type of error: E_bus error at line 1113 of Hwi.c (fault = "IMPRECISERR: Delayed Bus Fault, exact addr unknown"). Can this also caused by memory issue such as stack overflow?

      Thanks

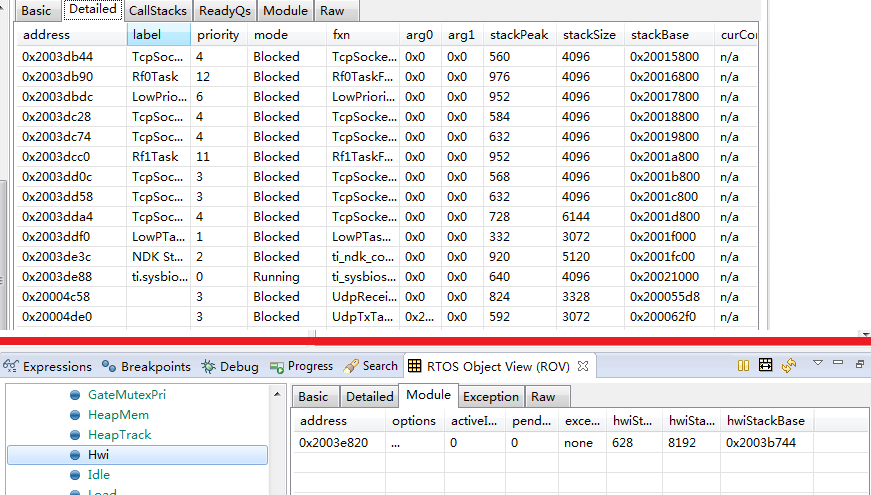
  • I found this issue could not be caused by stack overflow, because all stacks are below the address for the variable for BIOS type (ti_sysbios_BIOS_Module__state__V.threadType). In my map, the variable is at 0x2003EA44 (I can see "2003ea30 ti_sysbios_BIOS_Module__state__V" in the map file, and I also confirmed the address during debugging). The following is the snapshot for task and HWI stack in ROV, which show all stacks are blow the address.

    So definitely stack overflow will not modify the value for this variable.

    So then I think the issue could be caused by:

    1. Hardware issue. Is it possible?

    2. Things like dangling pointer that modifies RAM unexpectedly.

    3. A bug in BIOS code that doesn't set the variable expectedly.

    By the way, I have enabled HeapTrack for both Heap I am using (default and SDRAM), and no error related to heap track is raised.