Tool/software:
Dear TI Experts,
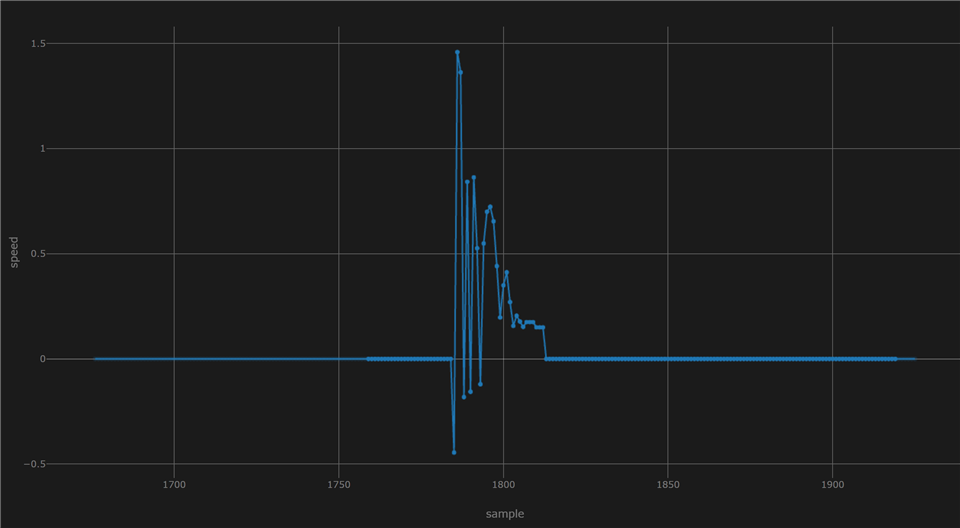
In my project, I am monitoring the health of my PID controller by observing speed changes live using the graph view. I have a variable that updates every 1 millisecond, but when plotting this data on the graph, it appears to have a lower resolution than expected.
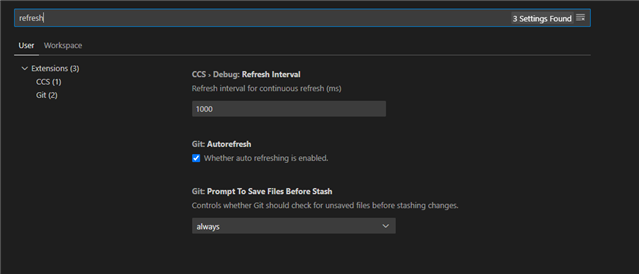
Is there an option to improve the resolution of the graph to better match the update rate of my variable? Or should I consider lowering the timer interrupt interval for better synchronization with the graph?
Thank you for your assistance!
* I update the speed in universal_motorcontrol_lab_f28002x (at systemVars.timerBase_1ms case 1) , using CCS 20,board f2800025c
, 


