This thread has been locked.

If you have a related question, please click the "Ask a related question" button in the top right corner. The newly created question will be automatically linked to this question.

Select the right motor driver to be used with PGA460 in monostatic configuration

Other Parts Discussed in Thread: PGA460, DRV8870, DRV8844, DRV8313, DRV8312, DRV8412, DRV8837C, DRV8837, PGA460-Q1

Good morning,

I'm developing an ultrasonic application with PGA460.

Using this component in monostatic configuration, it is recommended by TI experts to use an external motor driver to control the transducer.

At the moment TI suggest to use DRV8870, but in my application we are outside the specs, because I need to drive the transducer with a PWM of around 220kHz.

Do you have a part number with these mandatory characteristics:

1) PWM frequency: 220kHz or more

2) separate inputs to control the full bridge (like DRV8870)

It will be useful also to have:

1) shutdown pin or

2) low power device

Waiting for a kindly answer, I wish you a nice day

Best regards

Alessandro

  • Hi Alessandro,

    When operating at high PWM frequencies, there are several devices to consider

    1) DRV8844
    2) DRV8313
    3) DRV8312
    4) DRV8412

    These devices can operate at high PWM frequencies. The sleep currents are higher than the DRV8870.

    The outputs of the DRV8844 and DRV8412 can be paralleled to provide more current.
  • Hi Rick,
    thanks for your answer. These devices have an output current very high for my application.
    I need no more than 50mA to drive my transducer. At the moment I'm driving at 7.5V @30-40mA.
    This morning I was looking on your website and I found something interesting.
    What do you think if I will use the DRV8837 (or DRV8837C)?
    Let me know, thank you.
    Kind regards

    Alessandro
  • Hi Alessandro,

    From the perspective of driving an ultrasonic transducer, the DRV8837 seems to a be feasible low-voltage alternative if you do not intend on exceeding its 11V maximum input operating voltage rating. The DRV8870 was initially selected to enable the PGA460 full-bridge reference design to generate a peak voltage up to 45V (beyond the PGA460's 30V maximum supply rating).

    With your low driving voltage requirement, is it possible to reconsider a discrete half-bridge driver? If you need a total of 15V peak-to-peak, the transducer doesn't care if the swing is in the positive-domain only (0 to 15V), or split between the positive and negative domains (-7.5 to +7.5V). It may be easier to incorporate a voltage-doubler exclusively dedicated to supplying the high-side rail of the half-bridge driver, rather than attempting to generate a full bridge swing using a motor driver.

    When I demonstrated the performance of the Massa 200639-501 (Model E-188/220) to Sam, I did so using a half-bridge driver, which only requires a single high-side pMOS if implemented discretely. See the PGA460 Mono-static Transducer Half-Bridge Driver Small Form Factor Design File (www.ti.com/.../slac755).
  • Hi Akeem,

    I spoke with Sam and we discussed about the half-bridge configuration.

    The reasons why we are not confident to use this configurations are:

    1) half-bridge has lower performances compared to the full bridge drive (as explained also in SLAA780)

    2) to compensate this, as you suggest, we need to increase the voltage at around 15Vpp

    Doing this, the problem is related to the certifications that we have to satisfy (ATEX)

    If we stay, under 10V, the procedure is "painless" or not so painful as if we use voltage above 10V.

    I'm not an expert in ATEX, but I will double check to be sure that the information that we have are correct (is a matter of ignition and energy stored in the system, and for capacitors is proportional to square voltage...).

    At the moment, driving the PGA at 7.2V we can detect targets from 8cm up to 45cm (@room temperature, 22°C). So we matched the specifications (10cm - 30cm)

    I will play also with the damping resistor and time-varying gain, to try to reduce the lower limit at 6cm, but I think we are close to the physical limit of monostatic configuration.

    Anyway, I will realize the final PCB foreseeing also the half bridge configuration, for many reasons:

    1) to be more flexible and opened

    2) future cost reduction

    3) future systems that will require different measurement range

    I have to check if it is possible on PCB side, but I think so...

    Thank you so much for your helpful support, I hope to work with you again in the future ;-)

    Kind regards

    Alessandro

  • Hi Akeem,

    I'm proceeding further in the tests and I discovered something that I cannot understand, I hope you can help me in understanding.

    I started to make some tests with different driving frequencies (using Massa 200639-501)

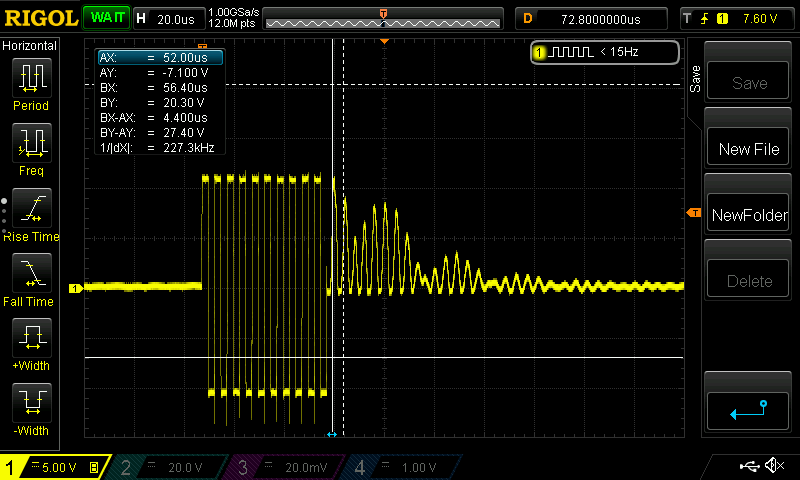
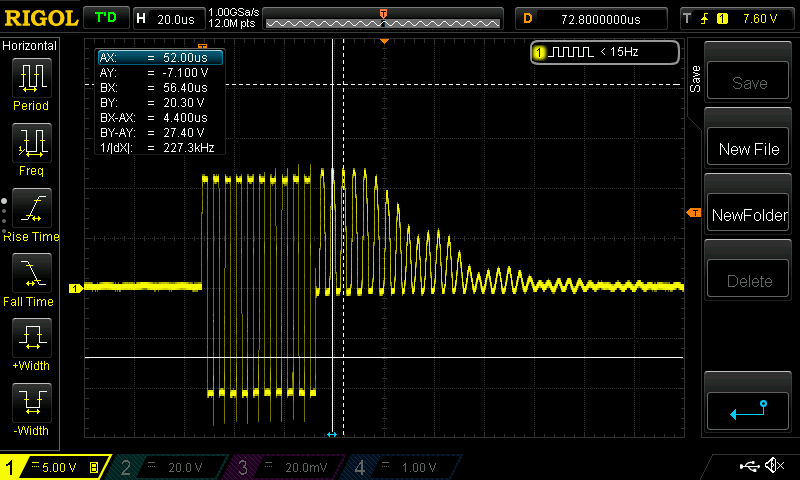
    I tried 220kHz and 200kHz. Attached I putted the plot results from GUI and oscilloscope waveforms (acquired directly on the pins of the transducer)

    200kHz driving: oscilloscope waveform

    200kHz driving: GUI plot

    219.6kHz driving: oscilloscope waveform

    219.6kHz driving: GUI plot

    Now the questions:

    1) Why the GUI plots are really better with 200kHz, but with the oscilloscope I see a better waveform (for decay) with 220kHz? In fact the datasheet of the sensor say that the best performances are at 220kHz...

    2) Diagnostic: To measure it properly, with this kind of waveform, I have to put 0 as time delay and 9-12 periods. Is it correct? Anyway I have a 250kHz result in diagnostic, instead of 227kHz that I measure with the oscilloscope...How it works?

    3) Diagnostic: I'm using burst+listen checked; Is it correct?

    3) Noise level: the GUI says a value of 129 (dec), but How is it representing? I didn't understand it from datasheet and I cannot see in the GUI a so high noise floor

    Thank you so much for your help. If you prefer, we can plan a conf-call to speed up this process (so also my colleague Samuel Brugger can join the discussion)

    Let me know what do you think about.

    Kind regards

    Alessandro

  • Alessandro,

    Responding to your questions:

    1) I recently revisited the bandpass bandwidth coefficient calculator for the high-frequency range, and suspect the A2 coefficient is at fault for the difference in ringing-decay and peak echo amplitude for the 200kHz vs 220kHz plots. I have updated the GUI (v1.0.1.1 - to be released this week) to generate a more accurate A2 coefficient value. In the meanwhile, try forcing these newly recommended A2 coefficient values for comparison:
    kHZ 2kHz 4kHz 6kHz 8kHz
    200.4 B1FE B279 B2F1 B368
    219.6 CFB3 CFFF D04A D093
    Let me know if these values yield any improvement. I would expect that the peak amplitude for the new 219.6kHz measurement should be saturated, just as you have seen with your old 200kHz measurement.

    2) You are correct that the frequency diagnostic requires a burst-and-listen command to be executed prior to pulling diagnostic results. Try offsetting the start time to a non-zero value since there is a slight phase shift immediately after releasing the transducer from burst. This instant phase shift usually results in a more erroneous frequency measurement. Try sweeping a few different combinations of the start time and period until you achieve a results that is closer to the transducer's specified value. Have you referred to the transducer frequency measurement example on page 21 of the datasheet? Here is the frequency measurement explained by the datasheet:
    To measure the transducer frequency, a start parameter, FDIAG_START, and a window
    length parameter, FDIAG_LEN, are defined in EEPROM memory. The start parameter,
    FDIAG_START, defines the time when the frequency measurement starts relative to the end
    of the burst time. The diagnostic window length parameter, FDIAG_LEN, sets the time width
    of the diagnostic window in terms of signal periods captured.

    3) The noise level measurement runs a preset 2 listen only command for a 8.192ms record length. An averaged value of 129d out of 255d is rather high. When you run a preset 2 listen-only command, what is your approximation of the average noise floor value at the echo data dump. Here is the noise level measurement explained by the datasheet:
    During the noise-level measurement, the PGA460-Q1 device executes the LISTEN ONLY
    (Preset2) command (see the Interface Description section for details of the command) where
    no burst is performed but only a record interval is started and lasts 8.192 ms. During this
    record interval, the data collected at the output of the digital data path is averaged into two
    groups each containing 4096 samples. The final noise level is measured by performing the
    noise-level measurement function is the higher averaged value of the two groups. This value
    is reported as the final noise-level measurement.

    Let us see if the new A2 coefficient improves all three of these points before we schedule a call.
  • Hello Akeem,

    regarding your answers:

    1) I forced the parameters that you wrote, and now the behaviour is similar for 220kHz and 200kHz.

    I think it is an issue as you mentioned...Thank you and let me know when the new GUI will be available for download.

    2) I found a good config with these parameters: start=100u; length=9 period

    But I cannot understand why, waiting 100us, the PGA is able to measure the freq.

    If you compare the fig. 11 of datasheet and the pictures that I attached in my previous message, you can see that waiting 100usec. in my case, the decay is almost finished.

    Because my sensor is 200kHz and it is built to do SR measurement. So the decay is faster than in the other kind of transducers.

    What do you think about? Is it reasonable what I say?

    I think the best option for us, is to have a shorter setting for START. Do you think is it feasible to be implemented?

    3) I understand now, and I read more carefully the DS.

    I was using an high starting gain, this means that I was integrating a large amount of noise (anyway not 120).

    Now I changed the settings and I reduced the initial AFE gain, and I increased a lot the digital gain, that is after the filtering stage, so the noise integrated is less.

    Do you think this is the best way to do it?

    I see that the results now are really better! Noise is in the range of 2-5.

    I have other questions, related to the setting and test mode functionality.

    I think the fastest way to discuss all of them is to set up a conf call.

    What do you think about?

    Let me know thank you and kind regards

    Alessandro

  • Hi Alessandro,

    1) Thank you for confirming the updated coefficient values improved the results of the 220kHz setting. You say they are similar, but are the 220kHz results superior to the 200kHz results (in decay time and/or peak amplitude)?

    2) You are correct in that a high-frequency transducer will typically decay much faster, so a low value start time such as 100us is more applicable. The frequency diagnostic is primarily checking for instances of zero-crossing, so the amplitude is irrelevant to the frequency diagnostic measurement. You want to set the frequency window where the resonant frequency of the transducer is least likely to be impeded by residual transmit energy or loading effects, which is why a non-0 value is more suitable.

    3) Yes, your method of reducing the initial AFE gain, and applying a large digital gain (especially at the long range), will yield a more reliable noise measurement result.

    4) To further discuss the test modes, please also include and coordinate with Hansjoerg to setup a call/Webex for sometime next week.
  • Good morning Akeem,

    1) 220kHz is higher than 200kHz, but in range of 10 decimal units (not more). If you have the new release of the GUI let me know and I can perform a comparison test!

    2) Ok clear, Thanks for your explanation!

    4) I wrote an email to h-spuler@ti.com, to set up the call

    See you soon, thanks for your support and kind regards

    Alessandro