This thread has been locked.

If you have a related question, please click the "Ask a related question" button in the top right corner. The newly created question will be automatically linked to this question.

BQ27510-G3: Battery Capacity Inconsistent and Inaccurate

Part Number: BQ27510-G3

Hi, 

I have performed what I thought was a successful learning cycle on my 1S2P 18650 battery pack but the fuel gauge provides inconsistent results especially when seeing higher loads. A few things I have observed:

1. Starting from a fully charged battery, the fuel gauge shows what appears to be a normal discharge curve until it hits about ~50%. Then it drops right to 0%. Battery voltage is still around 3.7V OCV.

2. Another example. When charging the battery the capacity is reported to be 30%. If I stop charging the capacity will drop to 0%.

3. Reported Capacity looks normal when charging.  

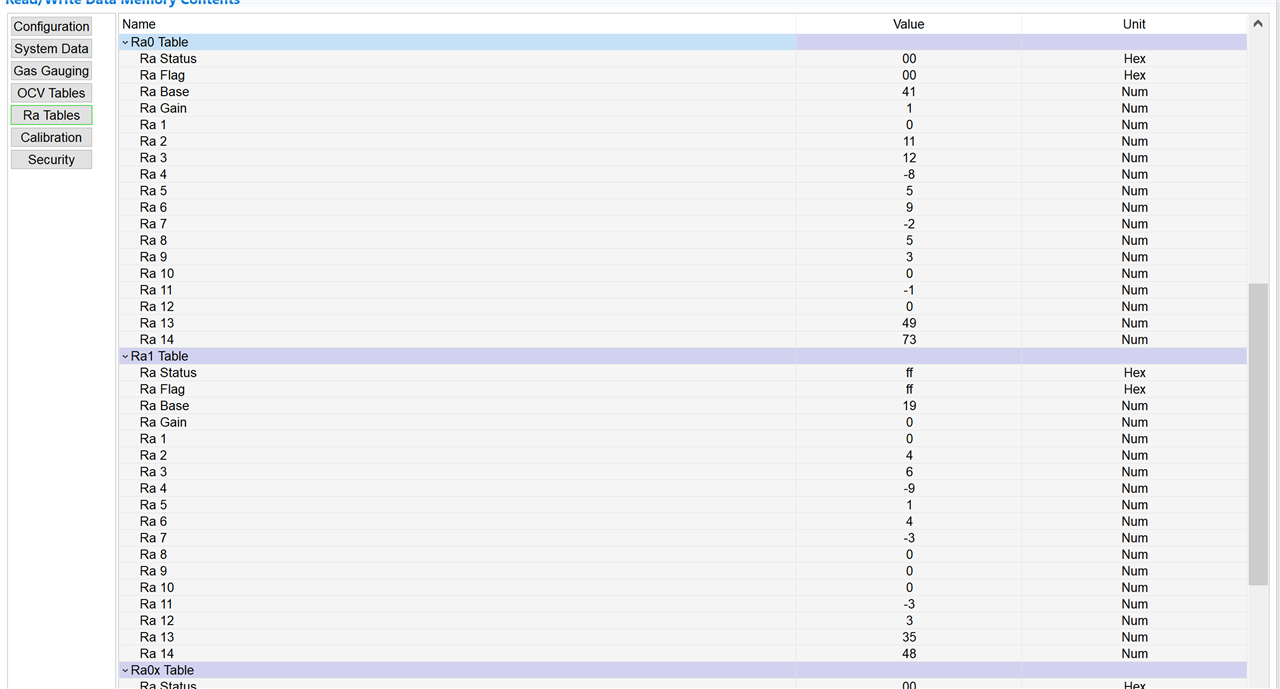
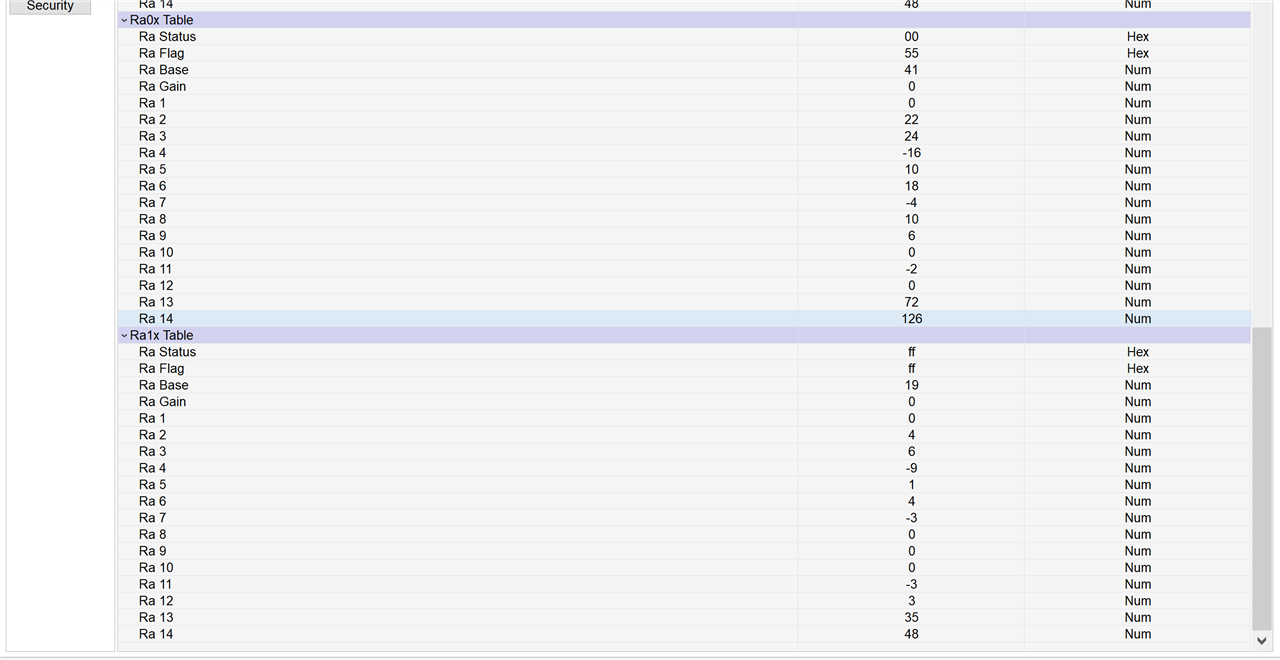
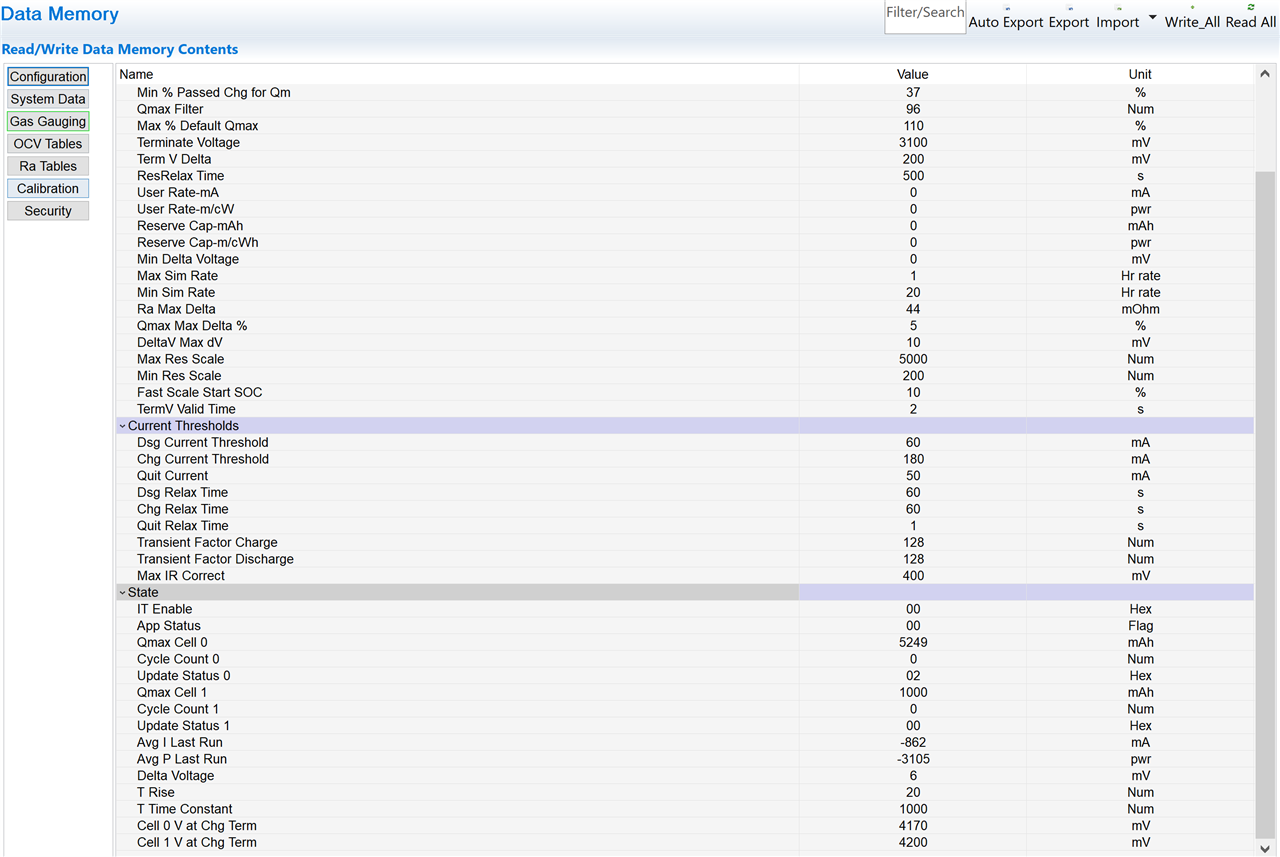
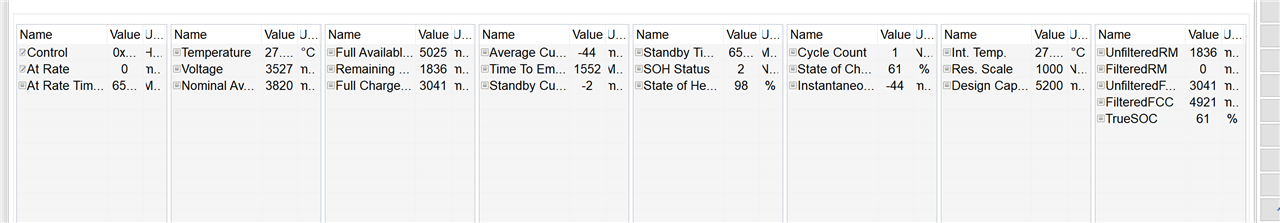
I have attached my logs from my learning cycle for review. Appreciate any help

Thanks

Eric

18650 Logs.zip

  • The problem is that QMax was not learned correctly and subsequently the gauge disqualified Ra updates (because DOD was incorrect, which resulted in negative calculated Ra).

    QMax is 3368mAh in the first gg file. Why is that?

    Please set initial QMax to Design Capacity 5200mAh and re-do the learning cycle. At the end of the learning cycle, Update Status must be 0x02, RUP_DIS in Control Status() must never be set during a discharge.

  • Hi Dominik,

    I redid the learning cycle. It completed successfully although I still had a couple of Ra values that ended up being negative.  The discharge seems to work well but then suddenly drops to zero. I have to run an OCV Command to reset back to the accurate capacity. I'm assuming this has something to do with the RA values being negative?

  • The Ra values are not stored as absolute mOhm numbers. Instead, this gauge uses a differential format with a base and gain and delta values. A negative entry just means that the Ra for this entry is less than the preceding entry.

    If the gauge calculates a negative Ra, it will not store this in the Ra table (because it's invalid). Instead it will set RUP_DIS (=Resistance UPdates_DISabled) and disable Ra updates.

  • For clarity, the first part of your statement implies negative values are ok but the second half seems to say the opposite? I have attached my logs from the learning cycle. Is it possible to have these reviewed?

    08_21_2021_log.zip

  • To clarify:

    Negative entries *in the Ra table* are ok, because the table stores the difference between grid point values.

    So if the absolute resistance of Ra[X+1] is < Ra[X], then the relative entry stored in the table for Ra[X+1] will be negative. But that doesn't mean that the resulting cell resistance is negative (for example, if the gain value is 0, then this translates to an effective gain of 2^0 = 1. If base is 100 then the absolute value of Ra0 is 100mOhm. If the entry for Ra1 is -10, then the absolute value of Ra1 is 90mOhm, not -10mOhm).

    If the gauge calculates a negative cell resistance, then in this example, the entry for Ra1 would be <-100. If Ra1 would be -1mOhm, then the entry for Ra1 would be -101.

    However, the gauge will never store a resistance value entry that would result in a negative absolute resistance. It will simply set the RUP_DIS bit and disable all resistance updates during the discharge when this happened.

  • Hi Dominik,

    I am having some success with my bq27510g3 now but the SOC is still off. It discharges from 100% to around 15% but then adjusts (correctly) back up to ~45%. It begins to steadily drop again. After a little way the capacity jumps way back up to 60%. Seems to be related to the UnfilteredFCC changing to 3041 for some reason. Any idea why that would be happening? I assume it was an issue with the learning cycle. 

  • The gauge, by default, uses the measured load (average) as a basis for FCC calculations. The gauge does not calculate FCC (and remaining capacity) through discharge simulations all the time but only during specific triggers. For example in relax, when the voltage is stable enough or at the start of discharge or if temperature changes by more than 5 deg.C or during discharge, at 15 discrete levels of discharge or at end of charge or at beginning of charge etc.

    In between it coulomb counts.

    FCC is always a prediction, which uses present and past conditions. For example, if the cell relaxes, the gauge will take an OCV measurement and then it will run discharge simulations, one from a full charge to terminate voltage and one from the level determined by the OCV to terminate voltage. It then knows how much capacity you can get out from the cell for the predicted conditions (temperature and load) from a full charge and from the present level and then it will report FCC, RM and SOC.

    So if SOC drops from 100% to 15%, then this means that RM diminished from 100% FCC to 15% FCC during a discharge. This is calculated during the discharge at various times and in between it counts coulombs and subtracts these from RM.

    When it calculates RM and FCC through simulations, the unfiltered values will change if conditions changed (e.g. temperature and load). Therefore RM, FCC and SOC can jump. Which can be a reflection of reality (e.g. temperature changes drastically or load changed extremely) or it can be due to the gauge using an incorrectly learned cell resistance table and QMax (or it can also mean that the chemistry is totally wrong).

    It's basically impossible to say, why this happened without a log file, that shows exactly what was going on (from the last time the gauge took an OCV measurement to the time SOC jumped) together with the exact configuration (gg file) that was present at the time when the gauge took this OCV measurement (this is not necessarily the golden image because the gauge may have learned something that is different from the golden image).

  • Hi Dominik, thanks for your thorough response. I suspect it is possible that the cause is the temperature change as I see it steadily rising throughout the run as the battery voltage drops and current rises. Our battery pack also has a thermistor that is not the identical required coefficient (3435k). I was able to capture logs while doing a discharge at our max rate. Could you please have a look and see if you can determine what is causing the jumping around. 6825.Logs.zip

  • Hello, did you have an opportunity to review my logs? Any help would be appreciated. 

  • Sorry for the delay.

    Your log files show that the gauge estimates very little capacity at the first discharge simulation after start of discharge. The gauge's initial estimate for FCC (and RM) is based on the Avg P last Run, which is 3W. The actual discharge power is about 10W so the first grid point simulation will predict capacity for a 10W load instead of 3W.

    The issue is that your cell resistance is fairly large until grid point 4, where it diminishes significantly. What likely happens is that before grid point 4, the capacity simulation causes the simulated voltage to drop below terminate voltage prematurely, resulting in small FCC and RM. Once DOD crosses grid point 4, cell resistance is much less and FCC and RM recover.

    --> Set Avg P Last Run to 10000 and set Ra Base to 10 and Ra4 to 0.

    The manual Ra adjustments are not ideal but they will confirm, if the analysis is correct. If it is, the initial learning cycle wasn't done correctly.

  • Thanks for your response. Prior to that I determined that using Average Current vs Average P fixed the issue I was seeing. Your explanation was helpful in determining why.