This thread has been locked.

If you have a related question, please click the "Ask a related question" button in the top right corner. The newly created question will be automatically linked to this question.

BQ40Z50-R2: SOC diverges during small current drawn

Part Number: BQ40Z50-R2
Other Parts Discussed in Thread: BQSTUDIO

Hello TI Team,


Since few weeks ago, by increasing max discharge current from 23A to 30A (only during a 10s spike), we have been observing some weird cases that we would understand, an example follows.


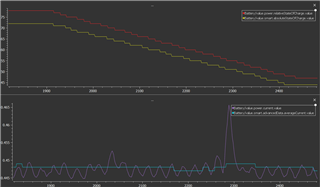
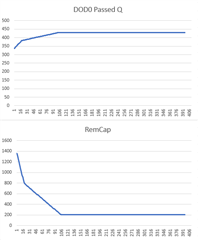
With a 75 cycles battery (more in reality, but our charger leads to not detected end of charge), SOH 96%, voltage 16.19V on a 4S LiHV pack, we observed that while consuming small current (450mA), SOC drops down by itself from 73% to 44%, same behaviour on integrated and remaining charges, which seems not in agreement to the current and average current.

Do you have any idea from where it comes from ? is it the gouge by itself ?

Many thanks for the help

  • Hello Robin,

    Are you able to share the log files from the test? I would also be curious what the .gg file looks like before and after this test.

    It will be hard for us to debug without log and configuration information. It may be due to a bad Ra grid point update during the high current pulse, then when you drop down to low current again in that region the gauge thinks there is a higher resistance than there is. But I need more information to know anything for sure.

    Sincerely,

    Wyatt Keller

  • Hello Wyatt,

    I hame some logs but not from BQStudio and not the exact one of the tests... But I can share the original firmware file and a memory dump following the isuse, attached.

    I hope this will help

    Thanks0028.Issue.zip

  • Hello Robin,

    I looked through the files sent, but I don't think there is enough information to determine anything. We would really need some kind of log, ideally a bqStudio log since it reads all the registers.

    So the average current and average power are not aligning? What is the lower section of your graph? Was the only change done was increasing a 10s pulse from 23A to 30A?

    Sincerely,

    Wyatt Keller

  • Ok I'll try to generate a log today.

    Yes, average and actual current are not aligned with the remaing charge curve, the remaining charge has a much higher rate that the one corresponding to the currents... leading to a huge drop in SOC values, but not the reality... 

    The only change we do is that during ~30s, we ask around 30A at device start, before it was close to 23A.

    Best regards,

    Robin

  • Here is the log generated during 2 small currents after the high current period. We can see the bad remaining capacity decrease rate, as the SOC incredible decrease. I hope it is that you need.

    Best regardsIssue.log

  • Hello Robin,

    Sorry I did not have time to go through your logs today, I will try to respond tomorrow with suggestions.

    Sincerely,

    Wyatt Keller

  • Hello Robin,

    What is your expected SOC and RemCap during this test? Everything in the log looks okay to me, there are no jumps in the SOC, FCC, or RemCap.

    Sincerely,

    Wyatt Keller

  • Hello Waytt,

    During this test, we should not having lost so many SOC%, only few % were expected (validated by an external power load also)... The RemCap is decreasing too much faster, compared to the real current we were using, it is completely abnormal (easy to compute using the integrate of current or averageCurrent compared to the RemCap curve...). For us, current and averageCurrent values are fine, RemCap and SOC completely wrong for a 3700mAh battery.

    Sincerely

  • Hello Robin,

    It looks like the gauge is expecting a much larger decrease in RemCap and SOC from the load that is on the batteries.

    If you compare the RemCap to DOD0 passed Q (the raw coulomb counting from the gauge) you can see the gauge knows how much has passed, but is expecting a lot of other reductions from it's simulations based on temperature and the Ra table.

    You can try changing load select to 0 instead of 7 so the gauge simulations aren't at such a high current. I noticed in your .gg file the Avg I Last Run is 1846mA and the Max Avg I Last Run is almost 20A, that's why the gauge is thinking there is much less capacity.

    Sincerely,

    Wyatt Keller

  • Hello Wyatt,

    Great we are going to test. What about using the 2 (current) configuration ?

    Other small question, we would show up a message to the customers having "aged" or "damaged" or "old" batteries but we can not rely on the state of health and cycle counts (due to bad end of charges and SOH is always > 95%). Do you have any field to check on for that ?

    Many thanks

  • Hello Robin,

    I would recommend using the Avg I Last Run. A lot of our other gauges actually have this as a default. The Max Avg I Last Run is the more conservative approach, but as we see it can lead to some issues if the load has high pulses. Using load select = 2 would mean the current at that exact time will be used to do the SOC simulations, so at low load it will think the SOC is high, but if the current increases near end of discharge there will most likely be an SOC jump.

    I'm not sure what you mean by "due to bad end of charge"? The SOH should report capacity degradation. You may need to change the SOH load rate to match your application to get better accuracy.

    Sincerely,

    Wyatt Keller

  • Hi Wyatt,

    Ok understood, thanks for the tip.

    Hum, we could not change the SOH load for customers unit, if you would not have the SOH value to check, any other value you would use to get a "aging" sign ?

    Sincerely,

    Robin

  • Hello Robin,

    You will need some comparison to a good packs values to estimate SOH. You would have to compare the Qmax and Ra table to see how much they're increasing by to give some estimation of SOH.

    Sincerely,

    Wyatt Keller

  • Hi Wyatt,

    I understand, many thanks

    Best regards