Answer:
Looking at two of our most popular space rated Class V Low DropOut (LDO)s in our offering, and our upcoming release to market for our flagship ultra-low noise, high PSRR TPS7H1111-SP.
TPS7A4501-SP, TPS7H1101A-SP, and the TPS7H1111-SP LDOs.
Each of these LDOs incorporate adjustable output voltages and are available in ceramic packages with radiation hardened performance and qualifications. The TPS7H1111-SP is available now for sampling, with full qualified version available 2Q23. The TPS7H1101A-SP is full featured with adjustable current limit, current sensing output, and soft start. The TPS7A4501-SP is the industry’s smallest wide Vin LDO. The TPS7H1111-SP is the industry’s best in class for low noise and high PSRR.
For specific details on their specifications and ratings, see respective product datasheets: TPS7A4501-SP, TPS7H1101A-SP, TPS7H1111-SP
Each LDO will have their typical PSRR results presented in their respective datasheets. Further information beyond the datasheet may be needed to properly decide the amount of voltage headroom required (Vheadroom = Vin - Vout) to maintain good PSRR performance across a particular application’s mission requirements while minimizing internal LDO power dissipation.
In order to properly measure PSRR, a voltage ripple needs to be injected onto Vin to create the voltage disturbance. This requires that the LDO’s input capacitance be eliminated as it would attenuate the signal injected. Subsequently, the test setup will measure the resulting ripple on Vout to determine the level of attenuation seen as the LDO regulates the output voltage. For an LDO, this can be expressed as PSRR = 20log(Ripple(Vin)/Ripple(Vout)). Prior to looking at the data, let us take a look at the test setup.

The results presented here were obtained using Omicron Bode 100 and a Picotest J2120A line injector. The diagram shows the required connections for hardware and the LDO under test.
The headroom for PSRR is not the exactly the same as the dropout voltage parameter (VDO) specified in datasheets. The dropout voltage is based on the LDO’s ability to maintain a certain threshold on Vout with static DC conditions for specific Vin and load. As Vin is reduced, at some point Vout will drop out of specification for regulation.
At this minimum Vin for dropout, PSRR will suffer as the regulator will see additional Vin drop as a function of the incoming ripple. See the following two examples with exaggerated Vin ripple near the minimum dropout voltage.
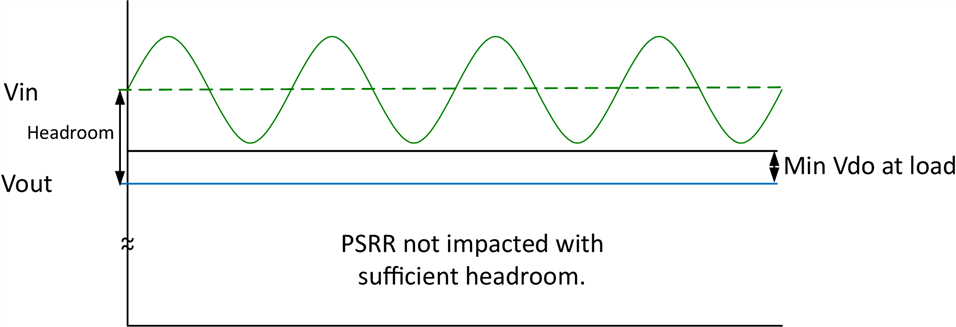
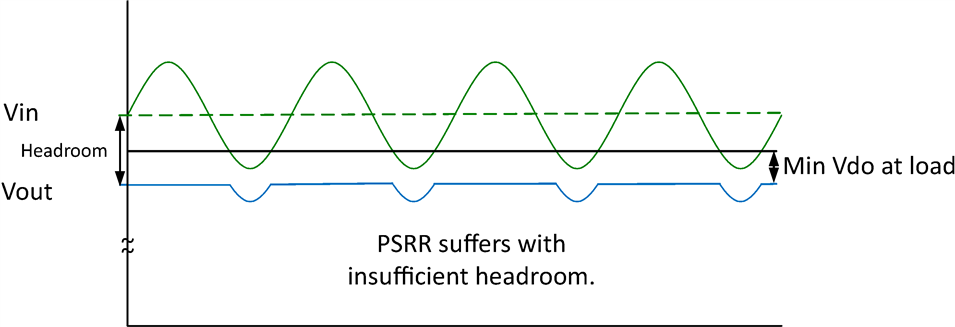
It is easy to see from this simplified example that the amount of headroom and the magnitude of the ripple will directly influence PSRR performance.
The amount of headroom required to achieve maximum PSRR performance will increase with the magnitude of pk-pk ripple on Vin.
The following figures shows the TPS7A4501 at several conditions that show the PSRR performance change with magnitude of signal injected during the test.
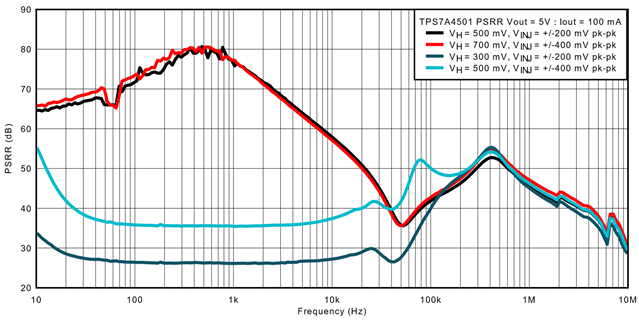
The top two curves represent optimum or near optimum PSRR performance at the given conditions. The red curve has +/-400mV of pk-pk ripple injected with 700mV of headroom. This represents 300mV of effective headroom from the bottom of the injected ripple to Vout. Similarly, this same 300mV difference on the black curve with a +/-200mV pk-pk injected signal with 500mV of headroom.
The bottom two curves represent 100mV of effective headroom from bottom of injected ripple to the Vout voltage. It is clear that the amount of ripple on Vin is critical in determining amount of headroom required to achieve full PSRR performance. The amount of headroom chosen should include assessment of the maximum Vin ripple from the source supply.
In addition to the headroom, load capacitance and load current also play influential roles in PSRR performance. The following graphs can be used to assess the performance of each device under various conditions and help determine the amount of headroom necessary for optimum PSRR performance.
The following sets of data utilized a 50ohm voltage source injected onto Vin of each LDO with -10dBm power. This represents 70.7 mV RMS (+/-200mV pk-pk) of injected ripple on Vin. The data is obtained with stock evaluation modules (EVMs) (TPS7H1101SPEVM, TPS7A4501EVM-CVAL, and TPS7H1111EVM-CVAL ) with exceptions of voltage setting resistors and input and output capacitances. In all cases the input capacitance is removed to prevent attenuation of the injected signal into the LDO.
The following sets of data are for each LDO each taken with various loads, headroom, and output capacitance. These graphs can be used to estimate performance at various conditions.
TPS7H1101A-SP PSRR summary data.
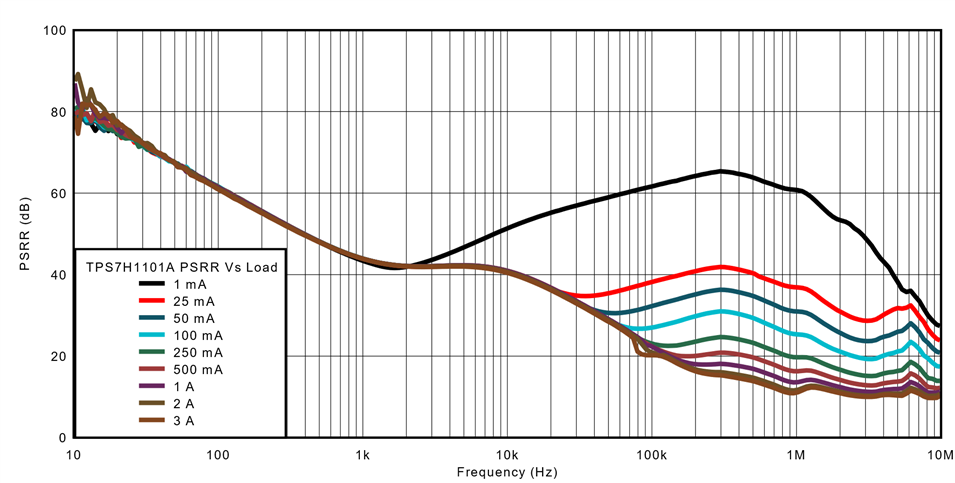
This graph shows the PSRR performance of the TPS7H1101A under various load conditions. In general, lighter loads tend to have improved PSRR performance at higher frequencies for this device. It has very stable performance across load in frequencies lower than around 30 kHz. PSRR performed with Vout = 1.8 V, and a Vin of 2.5 V.
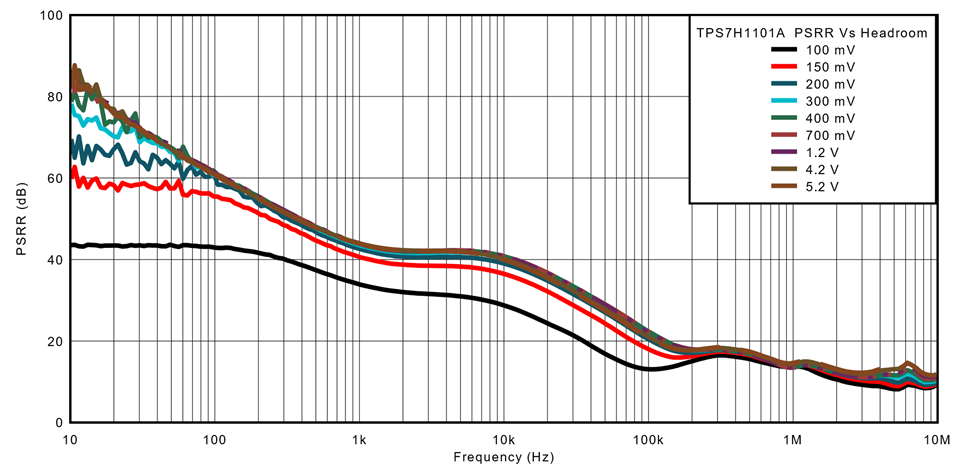
This graph shows the PSRR response of the TPS7H1101A with various amounts of headroom. Vout = 1.8 V, Iout = 1 A. Full performance achieved with ~400 mV of headroom using +/- 200 mV pk-pk ripple injection.
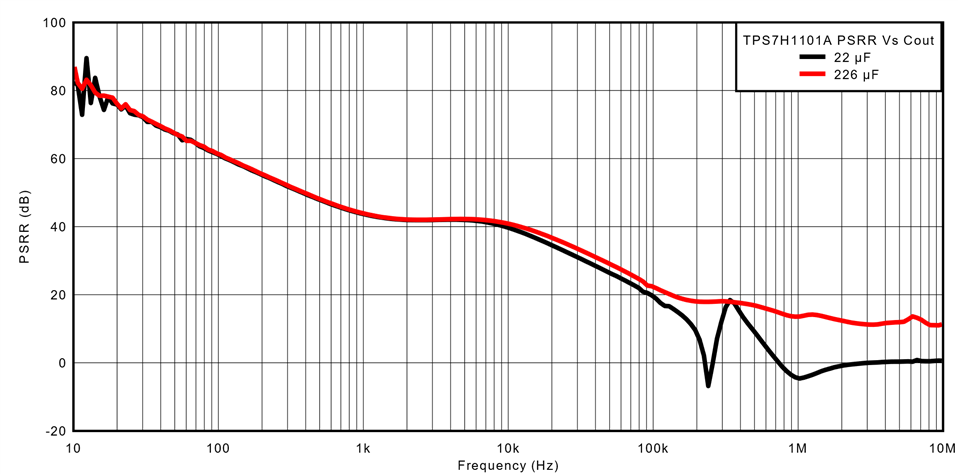
PSRR for the TPS7H1101A is not significantly influenced by output capacitance below 100 kHz. The zero introduced by the output capacitance and the load create a zero that can influence PSRR performance. In the case of the 22 uF, it would benefit from some additional capacitance. There is also some influence from the lack of input capacitance. Testing performed with Vout = 1.8 V, Iout 1 A.
TPS7A4501-SP PSRR summary data.
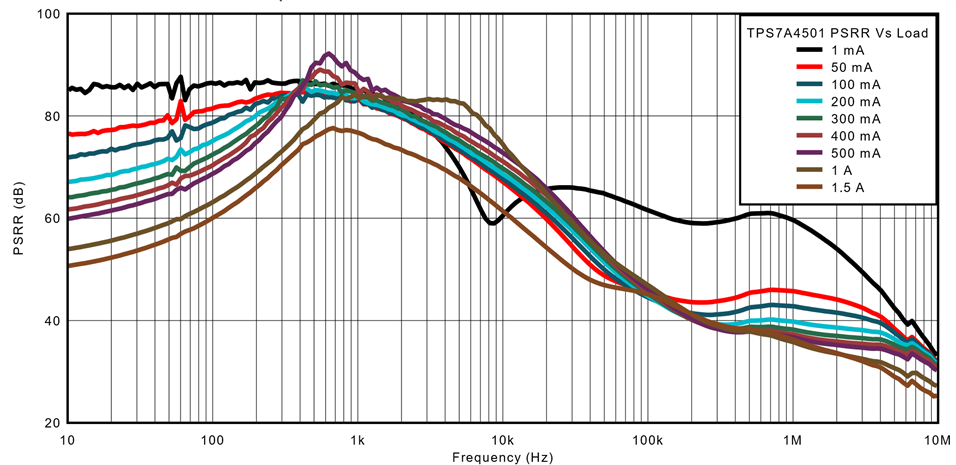
This graph shows the PSRR performance of the TPS7A4501 under various load conditions. In contrast to the TPS7H1101A, PSRR performance is influenced by load at lower frequencies and less significantly at higher frequencies.
PSRR testing performed with Vout = 1.8 V, and a Vin of 3.3V.
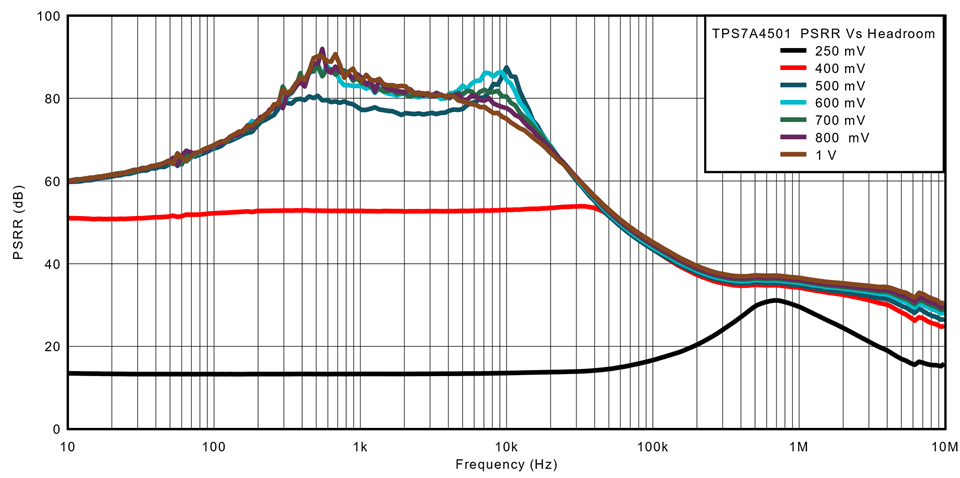
This graph shows the PSRR response of the TPS7A4501 with various amounts of headroom. Vout = 1.8 V, Iout = 500 mA. Full performance achieved with ~500 mV of headroom using +/- 200 mV pk-pk ripple injection.
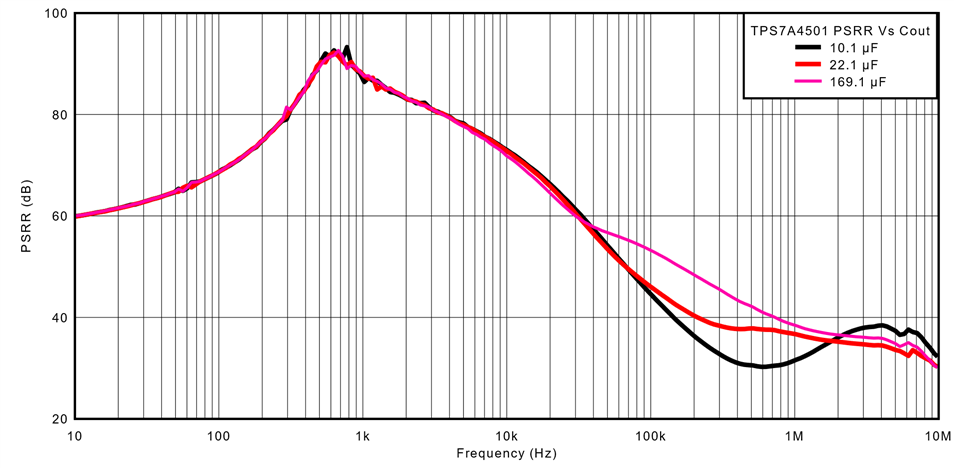
This final graph shows the influence of Cout on the PSRR performance for the TPS7A4501. Essentially performance is similar up to approximately 30 kHz, where some additional PSRR gain is achieved with larger capacitance.
TPS7H1111-SP PSRR summary data.
The TPS7H1111-SP incorporates a bias rail that can be optionally connected to a higher voltage rail than Vin. This higher supply is used to help achieve low dropout, and excellent performance for both noise spectral density and PSRR.
The TPS7H1111-SP datasheet has a large amount typical results for PSRR at various input, output, load, and bias conditions.
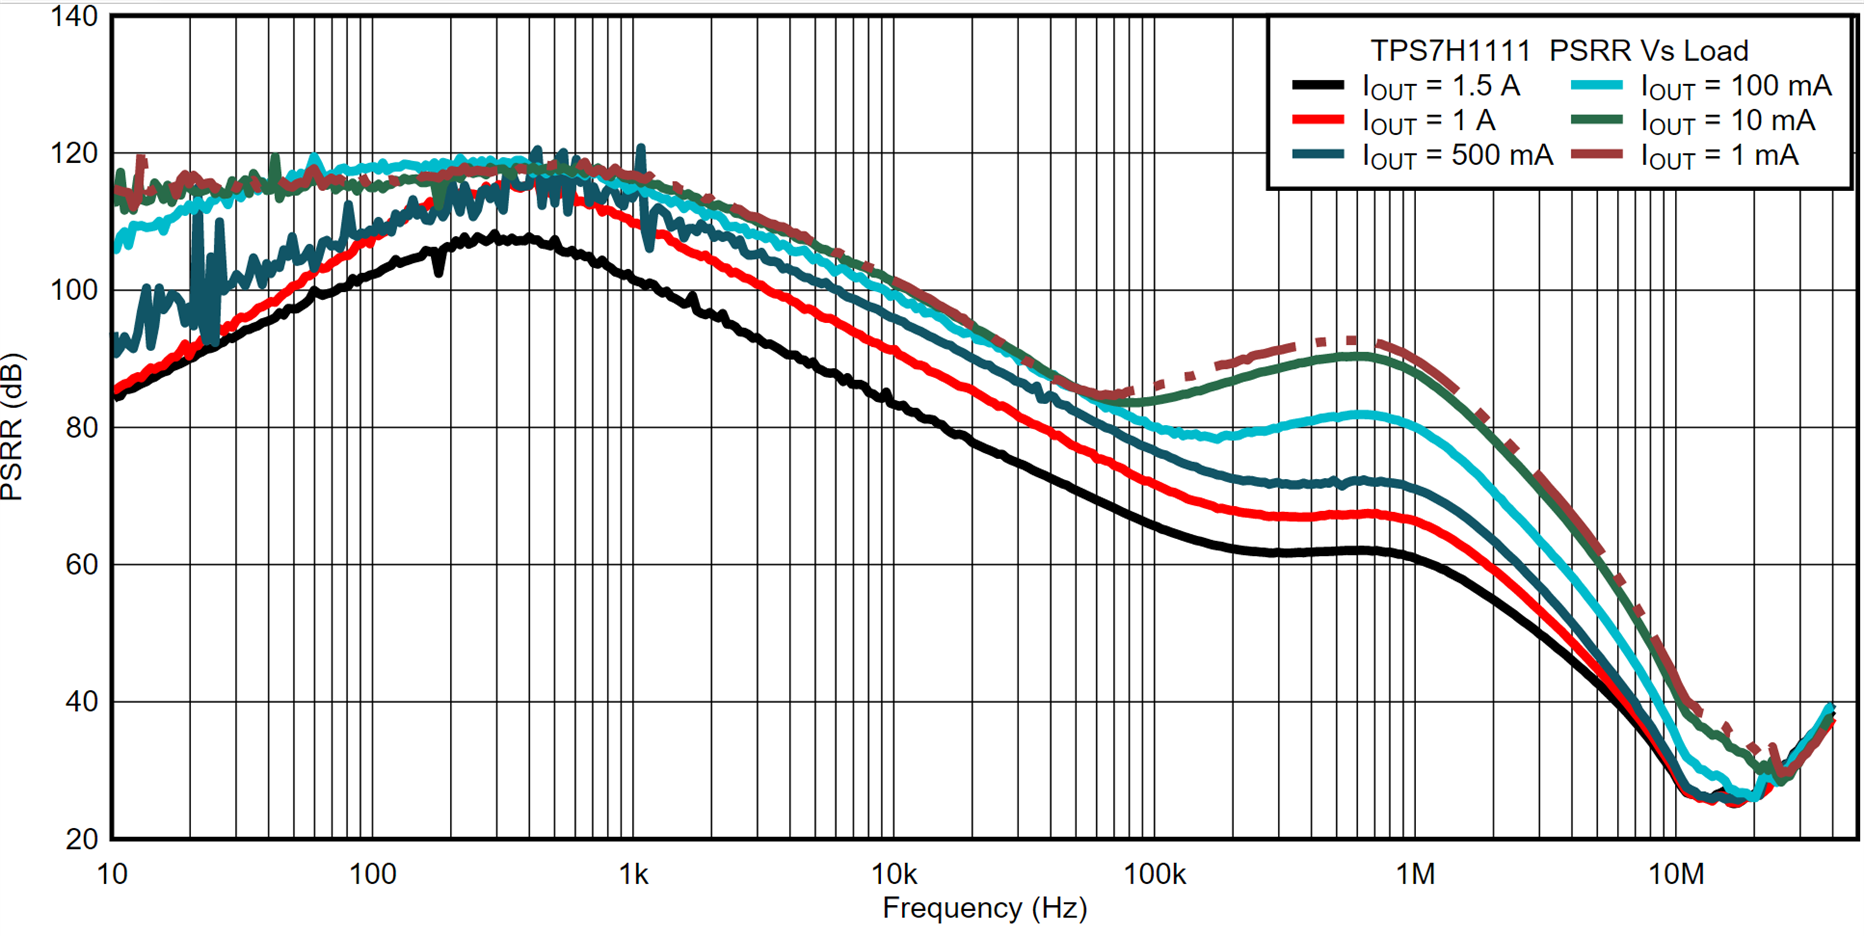
This plot shows the typical configuration of Vin = 2.5 V, Vout = 1.8 V, Vbias = 5 V with various load conditions.
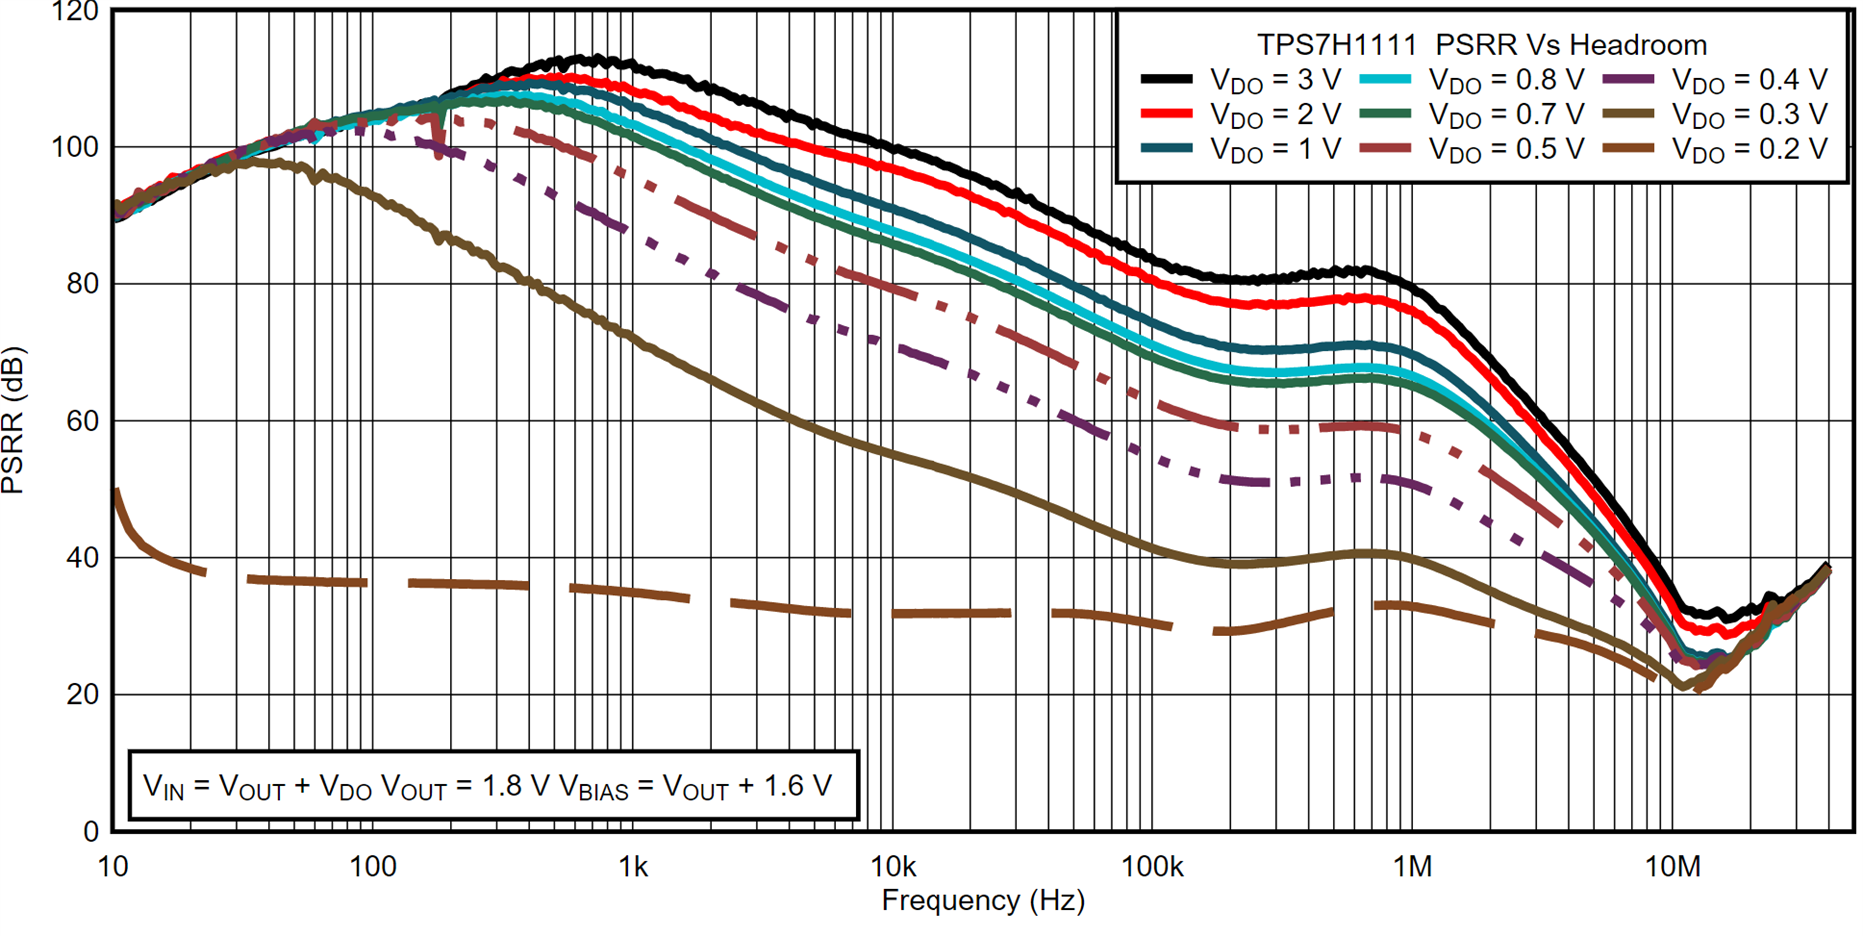
This plot shows the PSRR performance with respect to varying VIN headroom with minimum VBIAS voltage for maximum PSRR performance with Iload set to 1 A. VBIAS can be lowered down to VIN, but will introduce its own headroom requirements. See datasheet for further details.
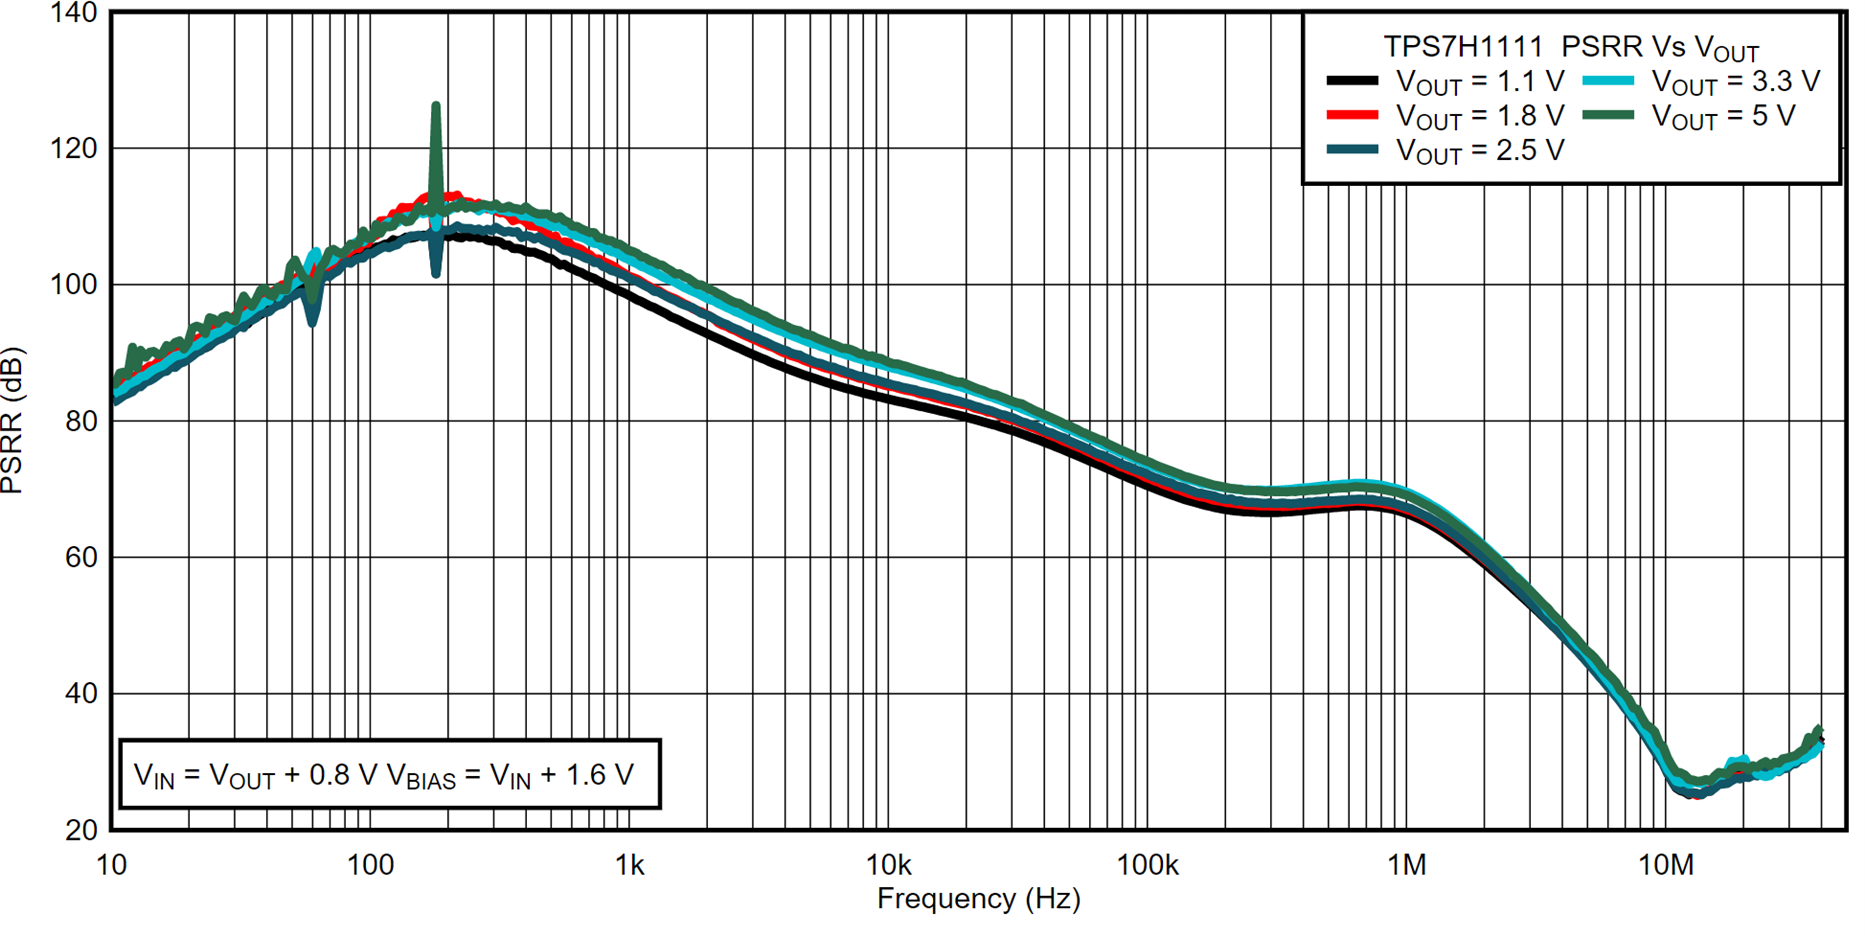
This final plot shows the PSRR performance at various Vout conditions using a output load of 1 A.
Conclusions:
To achieve full PSRR performance of an LDO, it is not sufficient to simply design to insure Vin equal to or greater than Vout + Vdropout. It is also important to consider the additional amount of headroom required to be able to attenuate the expected amount of Vin ripple from upstream converter. Secondary influences should also be considered for output capacitance and load current.

