


Part Number: LM76005QEVM
Other Parts Discussed in Thread: LM76005
Hello,
My customer would like to hear TI expert comments or opinion about efficiency data differences between EVM users guide and WeBench.
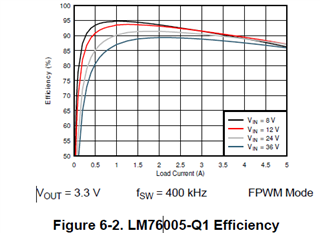
LM76005QEVM User’s Guide Figure 6.2 shows LM7600QEVM efficiency plots as follows.
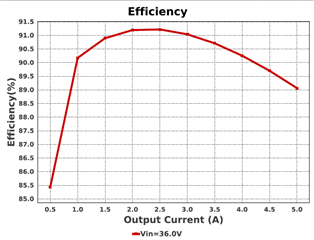
My customer try to mimic LM7600QEVM circuits using WeBench (please refer to the attached .pdf file) with the conditions, Vin=36V, Vout=3.3V and Iout=A. Its efficiency is as follows, looks a bit better than the plots for Vin=36V in Figure 6.2.
Q1:
Any suggestions about components parameters of the WeBench to make the simulation results match Figure 6.2?
Q2
Or WeBench simulation results tend to show this degree of better efficiency results than actual typical LM76005 device efficiency?
Q3
Or WeBench simulation results show LM7600 typical efficiency, but the sample used to take Figure 6.2 plots had incidentally a bit worse efficiency than typical efficiency?
WBDesign_Report.pdf
Best regards,
K.Hirano
