This thread has been locked.

If you have a related question, please click the "Ask a related question" button in the top right corner. The newly created question will be automatically linked to this question.

CSD19536KTT: SOA and its temperature derating

Part Number: CSD19536KTT

Hello,

I would like to ask you about the SOA of CSD19536KTT.
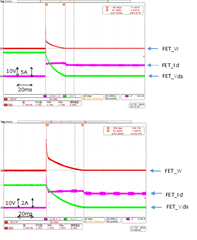
The attached figure shows the waveform when the FET turns on.
Is the behavior shown in this waveform acceptable for SOA?
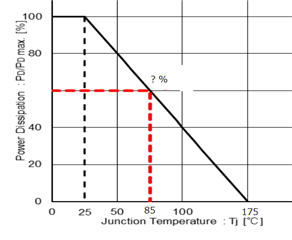
Also, please provide the temperature derating information for SOA as it will be used at TA=85°C. image as shown below.

Best regards,
  • Kajii san,

    Thank you for your interest in our MOSFET products.

    Our expert on these matters will get back to you when he returns to the office on Wednesday USA time to answer your questions on the wave forms you have provided.

    As for the impact of temperature on SOA, we have an article written in the link below that explains the impact of temperature on SOA.

    https://e2e.ti.com/blogs_/b/powerhouse/posts/what-s-not-in-the-power-mosfet-data-sheet-part-1-temperature-dependency

    Thanks

    Chris

  • Thank you for your reply. I will wait for an answer.

    I believe the SOA diagram is defined for a single pulse.
    In the waveform I measured, an excessive current flows at the moment the FET is turned on, and then it becomes a constant current.
    Also, the measured Vds has a potential difference of 24 V at the moment the FET is turned on, but the voltage difference gradually decreases.
    For such a waveform, please let me know how I can determine if it is okay for the SOA diagram.

    Best regards,

  • Hello Kajii san,

    Thanks again for the inquiry. TI tests SOA to failure with a single, rectangular pulse. The failure current is then derated and used to create the SOA diagram in the MOSFET datasheet. In the waveforms you shared, there is some current overshoot when FET first begins to turn on. I cannot tell the magnitude or duration of the overshoot. You may want to zoom in to observe the details of that portion of the waveform. There is high power in the FET when Id is constant and Vds has an exponential decay. Using the SOA diagram in the datasheet, if I assume the voltage is a rectangular 24V, 28ms pulse, I estimate the SOA current is about 7.7A (the actual current is ~7A in the waveform). Similarly, for the second waveform with a duration of 53ms, I estimate the SOA current is approximately 5.6A (actual current is ~4A). Obviously, there is less energy in the exponential decay of Vds compared to a continuous drain-source voltage for the entire pulse width. As a first approximation, if I assume a linear decay, that cuts the energy by 50%. Exponential decay should be even lower. Based on this, I believe the FET is operating within the SOA limits in the datasheet. For elevated temperature, I normally use linear derating as shown in the e2e thread at the link below.

    https://e2e.ti.com/support/power-management-group/power-management/f/power-management-forum/616732/csd19536ktt-csd19536ktt-soa-curve-is-changed-depend-on-ambient-temperature

    Best Regards,

    John Wallace

    TI FET Applications