This thread has been locked.

If you have a related question, please click the "Ask a related question" button in the top right corner. The newly created question will be automatically linked to this question.

TL7700-SEP: Power management forum

Part Number: TL7700-SEP

The TL7700-SEP datasheet (SLVSF13A Rev August 2021) shows that the SENSE input current (Is) ranges from 1uA to 3.5uA over temperature, with a typical value of 2.5uA at 25C. That means even if I have perfect resistors in my voltage divider, Vhys will still have an error of +40%/-60% over the device's full temperature range. Is this correct? This makes it pretty hard to design something useful.

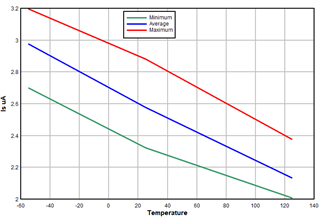
I'd like to assume that there will be a reduction in Vhys error if my environment has a narrower operating temperature than -55C to +125C, but I don't know how to determine how much. Is the relationship between Is and TA linear? I'm not seeing any characteristics graphs that show this relationship.

Thanks,
Will

  • Will,

    I just noticed your question has not been addressed.  I apologize for this.

    The engineer that supports this device is OOO, and this missed the handoff to other support.

    Myself or another team member will research this and reply back soon.

    Regards,

    Wade

  • Will,

    I was able to locate some characterization data that should help you understand the trend, and estimate any deration you are comfortable with for different temperature range.

    The blue line is the average of this characterization run, and would represent a typical unit.   The red and green were the min/max bounds of tested results for that characterization run, and can give you an idea of the variation that may be present at each temperature. 

    If this answers your question, please click this resolved my question.
    Regards,
    Wade

  • Thank you, Wade. This is exactly the kind of thing I'm looking for. This graph shows a much narrower range for Is than what is stated on the datasheet. Here, I'm seeing between 2uA and 3.2uA across the temperature range. The datasheet shows 1uA to 3.5A. Do we know where this difference is coming from?

  • You are welcome.

    The difference is that what I am showing you is actual data from a characterization lot.  The specification covers guardbanding and some amount of margin to cover manufacturability and additional process variation.   Typically limits are based on 6 sigma, so they are much looser than the actual process.

    So, the data is representative, but does represent the limits.

    Regards,

    Wade