This thread has been locked.

If you have a related question, please click the "Ask a related question" button in the top right corner. The newly created question will be automatically linked to this question.

UCC2897A: The gain and phase of the opto-coupler: SLUA535A

Part Number: UCC2897A

Hi, 

As per the equation. 96 in the application note SLUA535A, I have plotted the bode plot in MATLAB. It is showing different magnitude with fig.24. As quick reference I give below 

>> Gop = ((2e3)/(1/((1/499)+(1/(51.1+(1/(s*8.2e-9)))))))*(1/(1+(s/(2*pi*30e3))));
>> bode(Gop)


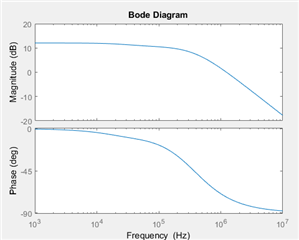
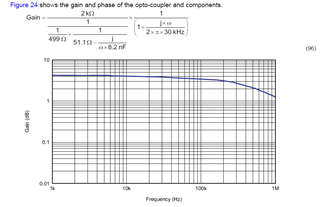
Please clarify the same. 

Thanks and Regards

Umamaheswararao

  • Umamaheswararao,

    You seem to have as similar thread open here so I would encourage you to continue the discussion you have ongoing with Eric. Regarding the Bode plot diagram of Matlab compared to what TI is showing in SLUA535A, it seems the corner frequency of both are happening near the same frequency but there is a difference in magnitude between the two. Your values in the Matlab code seem correct. Given that your frequency response is correct, I would say the there is a discrepancy between the SLUA535A equation and Bode plot shown. Thanks for highlighting and connecting through E2E.

    Regards,

    Steve M

  • Hi,

    Thank you for your reply. I will communicate with Eric. 

    Regards

    Umamaheswaraaro