

Hello Experts,
Customer would like to know PSRR data as Figure 9 in datasheet. The condition is Io=100mA, Co=2.2uF(same as spec).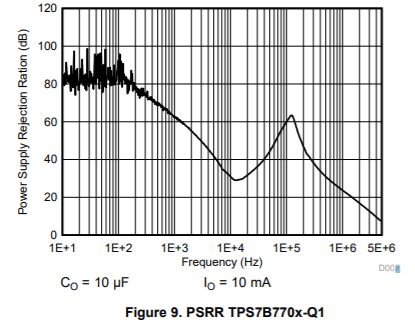
Best Regards,
Fujiwara

-
Ask a related question
What is a related question?A related question is a question created from another question. When the related question is created, it will be automatically linked to the original question.
