This thread has been locked.

If you have a related question, please click the "Ask a related question" button in the top right corner. The newly created question will be automatically linked to this question.

BQ34Z100-R2: Learning Cycle fails, does not seem to update all resistance grid points before Term V

Part Number: BQ34Z100-R2
Other Parts Discussed in Thread: GPCCHEM, BQSTUDIO, BQ34Z100

Hi,

I am trying to perform a Learning Cycle using the BQ34Z100-R2 on the TI EVM board connected to a 4S LFP battery. Spec is 12V 160Ah. Current and energy have both been scaled by 5 such that 160A reads 32000mA. Programmed ChemID is 400, which is not the exact cell I am using but according to GPCCHEM is the closest match with 7.59% max DOD error.


When attempting the learning cycle, it detects charge termination just fine, updates LearnedStatus to 0x05 almost immediately upon raising the FC flag (I'm assuming this is due to the LIFE mode set by the chemistry programming), but does not update to LearnedStatus 0x06 after a subsequent discharge, indicating that it is not able to learn Ra.

I checked the logs and RUP_DIS was not raised during discharge, the discharge rate was set to C/5, but I did notice that the value of GridNumber only spanned 1-13 over the discharge, where the Ra table in flash contains grid points 0-14.

A few questions arise:

  1. Is it correct that the gauge does not enter REST mode after charge termination, even though the battery was left to relax overnight (with power supply and load disconnected with a relay) before starting discharge?
  2. Why does the resistance table not get fully updated before terminate voltage? Is there a flash or config setting that I am missing here?
  3. Why does the gauge not enter REST mode when relaxing for more than 5 hours after discharge?
  4. Are there other indicators as to why the Learning Cycle is not updating to 0x06 that I should fix? Am I doing something wrong in the learning cycle procedure? Is the programmed chemistry too far off of the cell in use such that the Impedance Tracking algorithm gets confused?

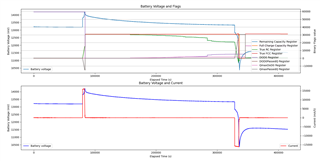
Logs of the failed learning cycle and a .gg export of the data flash values taken after the learning cycle are attached.

dataflash_after_failed_LearningCycle.gg.csv2nd_attempt_LearningCycle.log

  •     Please use version 2.02 for evaluation and test, v2.01 has some issues

  • I have installed FW version 2.02, and noticed that some dataflash variables do not match what is mentioned in the technical reference manual SLUUCO5 that is linked to from the BQ34Z100-R2 product page. For example the [SCALED] flag in the Pack Configuration Register is new, where the technical reference manual still mentions the bit is RSVD.

    Is there an updated version of the technical reference manual available somewhere that reflects changes made in FW v2.02?

  •     This is a legacy bit only for the user to indicate the host that the voltage or current or energy has been scaled, it is not used by FW either in G1 or R2.02, in 2.02, the scaling factor can be accessed by host via reading the relevant command for voltage, current and energy. Host does not need to use this bit anymore, but it can be still used for indicating purpose

  • Curious that the SCALED bit is then introduced from v2.01 to v2.02 even though there are indeed the voltage/current/energy scale registers present that replace the functionality.

    Regardless, I also have two questions regarding to the design energy register.

    1. I see in the release notes that specific feature has been enabled only in bq34z100-R2 v2.01 build 26, and as such it is missing in the data flash description table in SLUUCO5 (see screenshot below). Could you clarify the min/max value of the register so that I know the range I have to scale for?
    2. Regarding the units of the design energy register, SLUUCO5 mentions in section 3.2.5 and 3.8 that energy is reported in cWh, see image below.
      However, when I look in the dataflash using BQStudio, the BQ34Z100-R2 indicates units are mWh, which means I need to increase my energy scale factor. See image below.

      Could you confirm if the design energy units in R2 v2.02 are cWh or mWh such that I can scale the system energy correctly?
  •     The min/max value for the Design Capacity in Dataflash is 0 to 32767mAh, but it can be scaled with current scale factor, which ranges from 1 to 255.

        The unit of Design Energy is actually cWh, mWh is a typo in bqStudio.

  • I was looking for the min/max value of the Design Energy in Dataflash, I'm assuming it will be 0 to 32767 cWh and is scaled with the Energy Scale factor similar to design capacity and current scale, but can you confirm if that assumption is correct?

  •     Yes, it is the same as Design Capacity, and this parameter is already made visible in the latest TRM, you can check to download from the website.

  • I have attempted another learning cycle with the new FW version 2.02, but again the cycle does not seem to properly update the resistance table.

    This time I have captured the state of data flash before and after the attempted learning cycle, could you please take a look at the attached files and tell me why the Learning Cycle is not completing successfully? From what I see not a single resistance value seems to have been updated?

    pre_learning_cycle_memory.gg.csv

    post_learning_cycle_memory.gg.csv

    new_FW_LearningCycle.log

  •     I found the passed charge at end (row#51044) of discharge is even greater than Qmax, which indicates the Qmax is not learned correctly at row#9334,  then this may suggests that the DOD0 at this row is dubious. in correct DOD0 could probably caused by chem ID mismatch, please try choosing better chem ID or submitting the cell to TI for characterizing test

  • GPCCHEM_data-report3.zip

    GPCCHEM_data.zip

    See attached the GPCCHEM report based on measurements taken on this battery. I have programmed the first suggestion (ID 400), even though I know from experience that is a high C-rate, low-capacity cylindrical LFP cell where we are currently using high-capacity prismatic LFP cells for testing with the BQ34Z100-R2. What DOD error % is generally max acceptable for a proper learning cycle?

  •     For regular Li-ion chemistry, the guidance says 3% error is the criteria, but for LiFePO4, it may be eased due to the wide flat voltage area and long voltage relaxation period.

       But it does not mean that large DOD error can cause same error as regular Li-ion chemistry.

       For your case, the DOD error has to be ameliorate some how so that the Qmax learned at charge termination can be greater than the passed charge at end of discharge, if the chemistry is not to be recharacterized, then would you check the voltage is stable enough when the IT Enable command is sent, I can not the data long enough before IT is enabled, if the data is logged, you can check if the dv/dt over time(1000s) is less than 1uV/s?

  • I let the battery relax overnight after discharging with load disconnected, and waited until the REST flag was raised before sending the IT Enable command. Usually the REST flag only raises when dv/dt < 1uV/s correct?

  • The REST flag requires that the conditions were right for a DOD update in relax. One of the conditions is voltage stability. However, there are other conditions:

    Instead of stable voltage, the gauge will force an OCV measurement after a long timeout (default 5 hours).

    Also, with LiFePO4, it may take a very long time before the gauge qualifies a voltage reading (>48 hours), if charging stopped in the flat zone.

  • Hi,

    I did some further testing of the gauge for "convergence behaviour" to try and see how the gauge handles being mounted on a pack with unknown SoC during production. I see that the gauge starts taking increasing DOD measurements (purple) during the long relaxation period, and keeps reducing the remaining capacity (green) as a result.

    There is no current detected, hence the integrated charge not changing, so I think this is purely caused by the voltage relaxation. Normally, the remaining capacity should not change as the battery is not discharging, and especially not this much (battery SoC drifts from 100% at end of charge to 67% at end of relaxation).

    Considering your input above that the chemical profile might be incorrect (I am still using profile 400), is this expected behaviour in a system where the chemical profile does not properly match the cell in use? Is cell relaxation behaviour taken into account for generating the different chemical profiles such that the DoD does not start increasing when the cell relaxes if the correct chemical profile is used?

    Logging data is attached for reference:Initial_Convergence_testing_on_2nd_board.log

  • The voltage looks problematic in relax. Please make sure that you enable option LFPRelax in OpConfigB, which will force a 48 hour timeout in relax before the gauge attempts to adjust DOD0 by OCV.

    Your battery's voltage behavior in relax is concerning as it keeps dropping well past 48 hours, which is suspicious for an unaccounted current drain on your battery. Given the flat OCV curve for ChemID 400, the gauge will adjust DOD0 (as shown in your log file) and therefore it will change RM and SOC. So the question is, why does the battery voltage keep dropping without a current?

  • Could this long voltage drop be due to the fact that I am using 160Ah cells instead of the A123 2.6 Ahs? Since these cells are large prismatic LFPs vs nanostructured small cylindrical LFPs as captured in chemID 400, I'd expect much slower relaxation behaviours on the 160 Ah cells.

    Hence, I wanted to know if such dynamics of large cells are accounted for when generating a chemical profile, such that when these cells get eventually characterised in your labs this situation would not cause any incorrect SoC adjustments.

    LFPRelax is enabled, see below. I re-mapped the BQstudio colors to green=high, red=low. Is the behaviour from my log file expected then?

  • I don't think its possible to use the bq34z100 with cells that won't relax for >48 hours. The algorithm relies on OCV measurements and if OCV for all practical purposes never stabilizes, the algorithm won't work.

  • That is not great news, are there any fuel gauges that can work with these kinds of cells or is it a complete no-go?

    Additionally, I noticed in the chemistry database there were no cells larger than 50 Ahs recorded, is it just coincidence that you haven't characterised any larger cells or is that due to the fact that very large cells have large relaxation times and as a result do not work with your fuel gauges?

  • If your application regularly discharges to below when the cell voltage drops off rapidly and cell temperature is not <10 deg.C then CEDV gauges may be an alternative. For example: https://www.ti.com/product/BQ34110

    CEDV doesn't rely on OCV but instead uses coulomb count and loaded voltage during discharge (7% SOC threshold EDV2) to measure FCC. 

    Relaxation time is not primarily a function of capacity but of chemistry. It's a coincidence that we haven't gotten requests for very large capacity cells.

  • We will do some testing with the BQ34Z100 on the cells described by chemID 400 then. In the meantime, there is no other ChemID that has a longer relaxation behaviour and matches more with the cells in use in my measurements above?

  • No, we don't have a ChemID that is compatible with such long relaxation without stable OCV.

  • I have spent the weekend monitoring our other LFP batteries for their relaxation behaviour, see attached picture.


    The trace in green is the battery I have been testing the fuel gauge against for the duration of this thread, the ones in blue and yellow are a 105 Ah LFP battery and a 5 Ah LFP battery that contains the chemID 400 cells respectively.

    Although the relaxation behaviour is indeed very different from the battery I have used for testing up until now, I still see some slope in the battery voltage past 48 hours (though noticeably less). Can you confirm if such levels of relaxation are acceptable or not?

  • LiFePO4 in general are challenging. The IT algorithm uses a 48 hour timeout if the cells aren't charged high enough before using a voltage reading for this reason. The blue and yellow line show only a slight change in voltage after 48 hours, which, while not ideal, is going to work much better than the original chemistry.