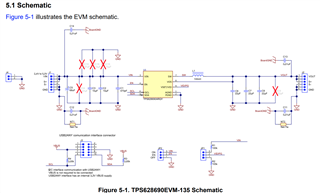
This thread has been locked.

If you have a related question, please click the "Ask a related question" button in the top right corner. The newly created question will be automatically linked to this question.

TPS628690EVM-135: Have some inquiry for Fsw, Ripple

Part Number: TPS628690EVM-135

Hello Expert,

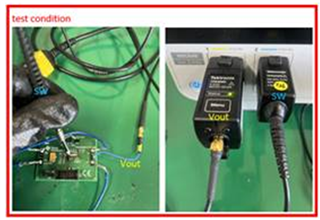
We are testing it at Vin 5V, Vout 0.475V condition and have some inquiry.

Could you please check and give me your opinion about each items?

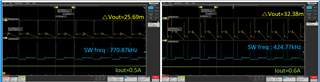
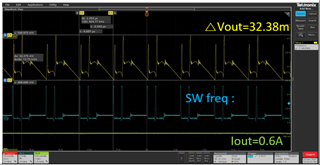
1) It was measured that switching occurred twice in the load current range of 0.6A to 1.28A.

    Please check whether this behavior is normal or not.


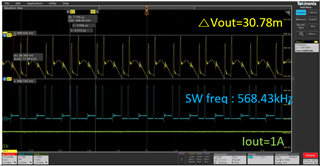
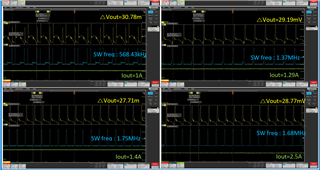
2) When we test the EVM, we can see that the mode changes from PSM to FPWM when load current reached 1.29A.

If we checked the graph on the data sheet, it seems to be in the range of approximately 0.5A to 0.7A.

Please confirm and what's the specification for threshold level?

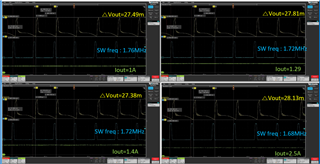
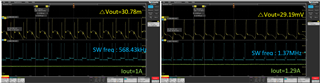
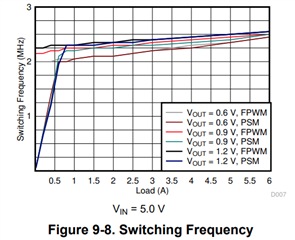
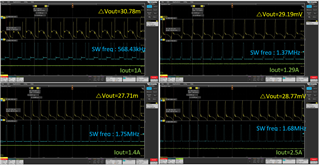
3) When the load is increased, the switching frequency increases up to 1.4A, but switching frequency is confirmed to decrease from 1.4A and above.

When we look at the datasheet, it says if load increased, Fsw increases and operates at over 2MHz.

Please check whether the swithcing frequency 1.6MHz ~ 1.7MHz at over 1.4A is normal operation or not.

4) The ripple is measured at 30mV not only under transient load but also under static load, which is higher than the ripple spec we consider of 22mV.

What is the applicable output capacitor value to ensure that the output ripple operates within 20mV?

What is the recommended output capacitor value or reference peripheral value to reduce ripple?

It is very important to adopt our product.

Best Regards,

Michael

  • Hi Michael,

    Thank you for sharing your waveforms.

    The frequency variation is explained in this paper: https://www.ti.com/lit/an/slyt646/slyt646.pdf It is normal.  You have a very small duty cycle, which requires a 40 nsec on time per equation 1 in the D/S.  This is below the minimum on time of the device, so the frequency will reduce.  As the load increases, it will reduce further.

    1. Yes, this type of pulsing can occur in PFM.  Does operating in FPWM mode solve it?  You can also try adding another output cap to see if that improves it.

    2. The figure gives an example for several conditions.  The 0.475Vout is a different condition.  With the reduced frequency, the PFM/PWM entry load will occur at a higher value.  For this device's DCS-Control topology, the transition load is approximately equal to the DCM/CCM point.

    3. Yes, this is normal.  See figure 4a in the app note.

    4. Your waveform is picking up a high noise.  The high amplitude spikes that line up with the SW node changing are picked up by the probe from coupling.  You can use a low inductance probe technique to measure the real ripple, which looks to be less than half of your measurement.

    Thanks,

    Chris

  • Hi Chris,

    I have more question.

    1. As shown in the waveform below, there is a delay between the SW pin and Vout.

        What's the reason?

    2. About Output Ripple.

    Output ripple was measured with a power rail dedicated probe.

    But, the ripple was measured at about 28mV.

    You can see it in the waveform image above.

    Can you provide detailed information on how to measure in order to measure almost identically to the data in the data sheet?

    3. About Output Ripple between PSM mode and FPWM mode

    In FPWM mode, the ripple must be smaller than in PSM mode, but it is measured almost the same.

    Is this also a probe technology issue?

    Best Regards,

    Michael

  • Hi Michael,

    Thank you for sharing your test setup.

    I have not used such a probe before, and it is unnecessary.  From the waveforms, I think it is adding the time delay between SW and Vout.  

    The photo is too blurry to see the details, but it doesn't look like Vout is measured with a low inductance connection.  This is critical to measure the ripple, without adding noise due to ESL in the measurement.  This app note compares different techniques to measure ripple: https://www.ti.com/document-viewer/lit/html/SSZTB25 

    3. Your measurement is adding much ESL, which dominates the peak to peak measurement.

    Chris