This thread has been locked.

If you have a related question, please click the "Ask a related question" button in the top right corner. The newly created question will be automatically linked to this question.

BQ34Z100-G1: SOH Calculation Mismatch with the actual state of Battery

Part Number: BQ34Z100-G1
Other Parts Discussed in Thread: GPCRA0

Hi

I'm looking for more details on SoH calculation as there is a discrepancy in the derived values from the gauge (BQ34z100-G1).  The image below mentions that SOH is the percentage of the ratio of Predicted FCC over the Design Capacity. The design capacity in the application is 10597 (Configured in the gauge) scaled up thrice to 31790mAh the actual Battery Capacity. 


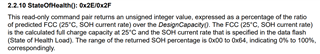
The discrepancy observed here is, the SoH is never 100% and always anywhere between 90% to 95%, even for the fresh battery packs fabricated with 1 or 2 cycles of charging and discharging and this remains the same for 250 cycles and up. With no observed drop in SoH degradation. 

The changes on the battery application level is the OV and UV cutoff is earlier, i.e. we are not "using" the full range of the battery capacity during the field operation. And as a matter of fact we are using around 95% of the capacity.

With respect to the above points, please assist with clarification on the following:

     1) Why is the SoH value never 100%? Is it related to the on-field battery capacity usage even though the battery health is 100%, the impedance track algorithm calculations disregard the unused capacity in the unused regions of UV and OV? 

      2) If the above is true, how can the derived SoH value be corrected? e.g. Should the battery be charged and discharged once fully including the the unused capacity in the UV and OV region so that the gauge "reads" actual capacity of the battery and the SoH corrects itself to 100%?

      3) How is the Predicted FCC calculated?


NOTE:The learning cycle was successfully completed with the above design capacity and with the same battery configuration and cell chemistry & cell manufacturer. (No changes in the Cell or battery configuration)
Load Mode:1
Load Select:1

Regards
Anvin

P.S. I've tried looking for answers across all the TI's  forum and documentation. Looking for more detailed answers.

https://e2e.ti.com/support/power-management-group/power-management/f/power-management-forum/1175682/bq34z100-g1-is-there-guidance-on-soh-calculations?tisearch=e2e-sitesearch&keymatch=BQ34z100%2525252520SoH#

https://e2e.ti.com/support/power-management-group/power-management/f/power-management-forum/1230981/bq34z100-g1-corelating-fcc-and-soh/4669416?tisearch=e2e-sitesearch&keymatch=BQ34z100%20SoH#4669416

https://e2e.ti.com/support/power-management-group/power-management/f/power-management-forum/1270574/bq34z100-g1-state-of-health-capacity-as-batteries-age/4814335?tisearch=e2e-sitesearch&keymatch=BQ34z100%2525252525252520SoH#4814335
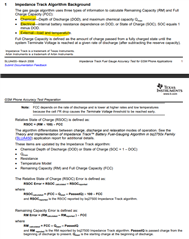
 slua948 (2).pdfslua455 (1).pdfslua450a (1).pdf


  • Hi Anvin,

    Please allow me sometime to verify some answers.

    Regards,

    Evan

  • Hi Evan,

    Sure, Awaiting for your answers. Please feel free to ask for any clarification meanwhile.

    Regards
    Anvin

  • Hi Anvin,

    Sorry for the delay.

    1) SOH is the ratio between predicted FCC/Design Capacity. What "battery capacity usage" are you referring to?

    3) Predicted FCC is the FCC at room temperature and SOH current rate which is the highest discharge rate for your battery.

    2) We can fix this by using the GPCRA0 tool it will update private parameters that should give you better SOH.

    GPCRA0 Application software & framework | TI.com

    Regards,

    Evan

  • Hi Evan,

    Thanks for the revert.

         1) The learning cycle was completed for the full Capacity of the battery and the Design Capacity was configured accordingly for this learning cycle. i.e. 31.7Ah for the battery voltage from 58.8V to 35V. The Battery usable capacity is limited to 92~95% Depth of Discharge on-field application by adjusting the OV and UV in the BMS i.e. the capacity used on-field application is 29.2Ah from 58.1V to 42V . When I mentioned "battery capacity usage" I was referring to the battery capacity used for on-field application. 
          To be more concise with the question, After flashing the same golden image on the fresh battery packs and using only 92% of the Energy from the battery for the on-field application i.e. (29.2Ah/31.7Ah) starting from the 1st cycle to 250 cycles and upwards, the SOH is always between 92% to 95% and is never 100% and there is no significant degradation of Battery Observed through SoH. Is the SOH Calculation getting affected by not using the entire capacity for the on-field application?

    Option A
    3) Is SOH current Rate same as the SOH Load 1 under Configuration Data? The SoH Load Current is set -15125 to be scaled upto the max discharge current of variable load of 45000mA. 45A is the application's Peak current, 40A is the Max current and the average current is around 15A, if the average current is to be set as SOH Load 1, then I believe the configured value should be scaled down by 3 and should be 5050mA. Let me know what you think of this SOH Load 1 value as shown below:


    2) I'll try out the GPCRA0 tool and let you know.


    Option B
    Also, I was thinking about using the Load Select values to user mode by setting it to 6 and shift the Cell Terminate voltage to align with the UV cutoff i.e. 42V and update Reserve capacity to 2.5Ah (31.7Ah-29.2Ah) to accurately derive the SOH to 100%. However, I was wondering if these values for Cell Terminate voltage and Reserve capacity should be scaled according the voltage scaling factor of 2 and capacity scaling factor of 3 for these registers below?


    FYI, I've scaled down the Voltage values by 2 and the current and capacity values by 3 and the Energy value by 10 in the configuration Data flash to fit inside Gauge Register bandwidth. PFA.
    Data Flash.gg.csv


    Let me know between Option A & Option B, where the SOH inaccuracy could be fixed or if it is not the root cause of the SoH inaccuracy at all.

    Regards
    Anvin

    P.S. I was trying to interpret the SOH Calculation with block diagrams as shown below, let me know of any corrections.

  • Hi Anvin,

    Let's go with option A first. Please let me know if things improve after this.

    1) This should not affect SOH

    3) Yes, all current and capacity parameters should be scaled. (3.1 in doc. linked)

    This document may be useful for you.

    bq34z100-G1 High Cell Count and High Capacity Applications

    Please allow me sometime to confirm some things with my team about your block diagram.

    Regards,

    Evan

  • Hi Evan,

    Thanks for the update.

    I've started testing with Option A, how many cycles of charging and discharging should be completed for the ideal corrected and accurate results?

    1) Thanks for the clarification on this.

    3) Thanks I'll recheck all the parameters and let you know if any discrepancy is observed. (As discussed above, SOH Load 1 user Configured value was incorrect since it was configured for the peak current of the load, whereas it should have been configured for the average current load).

    Sure, I'll await for the confirmation about SOH Block Diagram. This will help in understanding the SOH Calculations more easily!

    Regards
    Anvin

  • Hi Anvin,

    Sorry for the delay, your block diagram looks you have a good understanding of SOH.

    Regards,

    Evan

  • Hi Evan,

    Thanks for the confirmation on the block diagram.

    There is progress after making the changes.

    After changing the SOH Load 1 value from max current of load to the average current load value and completing 1 cycle of charge & discharge the SOH bumped to 96%  from 91%

    FYI, this was with resistive load. What can cause the SOH to not hit 100%?

    NOTE: LOAD mode:1 and Load Select:1

    Regards

    Anvin

  • Hi Anvin,

    Can you change your Load Mode to 0 and Load Select to 1 and see if things improve. These settings should be more optimal for your application.

    Regards,

    Evan

  • Hi Evan,

    Load Mode 0 is for constant current, my actual application load on-filed is variable current. The resistive load is only for temporary bench level testing.

    Are you suggesting me to permanently switch to load mode 0 i.e. constant current for the variable current load application on-field or only for the temporary testing on bench level?

    Regards

    Anvin

  • Hi Anvin,

    Thanks for explaining your set up. 

    If you wish to perform a temporary test using a resistive load, then I suggest using Load Mode:0 for best accuracy.

    If your real application, does not use a constant load, then Load mode:1 for best accuracy.

    However, I recommend replicating the load from your real application the best you can to test on, as the parameters to optimize your gauge could change from load to load.

    Regards,

    Evan

  • Hi Evan,

    Thanks for the confirmation. I'll make the amendments accordingly.

    Regards
    Anvin